Seminole vs Laotian Disability
COMPARE
Seminole
Laotian
Disability
Disability Comparison
Seminole
Laotians
14.9%
DISABILITY
0.0/ 100
METRIC RATING
337th/ 347
METRIC RANK
11.0%
DISABILITY
99.6/ 100
METRIC RATING
66th/ 347
METRIC RANK
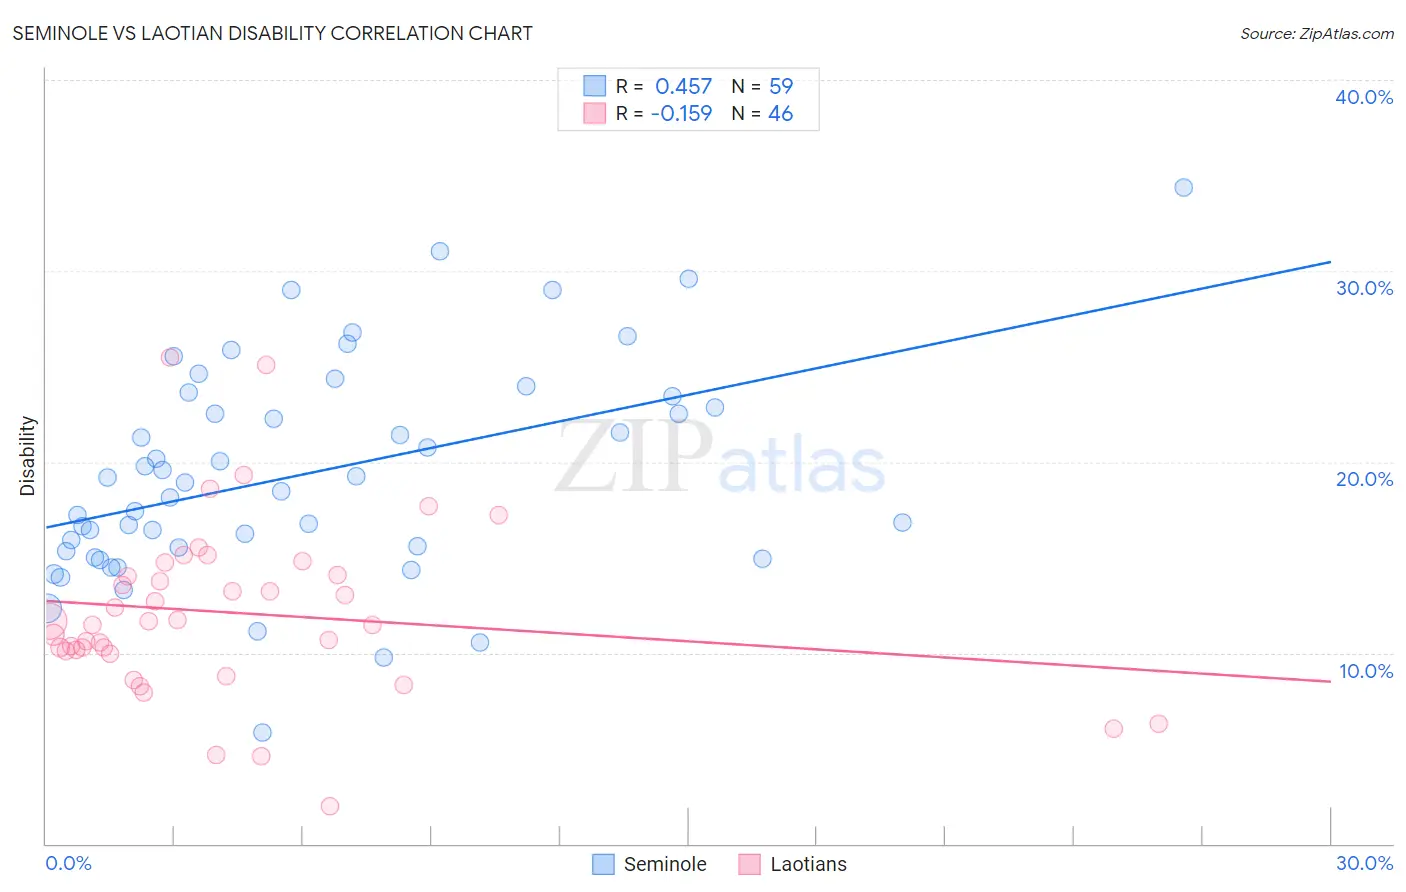
Seminole vs Laotian Disability Correlation Chart
The statistical analysis conducted on geographies consisting of 118,308,491 people shows a moderate positive correlation between the proportion of Seminole and percentage of population with a disability in the United States with a correlation coefficient (R) of 0.457 and weighted average of 14.9%. Similarly, the statistical analysis conducted on geographies consisting of 224,855,806 people shows a poor negative correlation between the proportion of Laotians and percentage of population with a disability in the United States with a correlation coefficient (R) of -0.159 and weighted average of 11.0%, a difference of 35.4%.
Disability Correlation Summary
| Measurement | Seminole | Laotian |
| Minimum | 5.8% | 2.0% |
| Maximum | 34.4% | 25.4% |
| Range | 28.5% | 23.5% |
| Mean | 19.4% | 12.1% |
| Median | 18.9% | 11.6% |
| Interquartile 25% (IQ1) | 15.3% | 10.1% |
| Interquartile 75% (IQ3) | 23.4% | 14.1% |
| Interquartile Range (IQR) | 8.1% | 4.0% |
| Standard Deviation (Sample) | 5.7% | 4.6% |
| Standard Deviation (Population) | 5.6% | 4.5% |
Similar Demographics by Disability
Demographics Similar to Seminole by Disability
In terms of disability, the demographic groups most similar to Seminole are Cherokee (14.8%, a difference of 0.090%), Dutch West Indian (14.9%, a difference of 0.30%), Tohono O'odham (14.8%, a difference of 0.61%), Yuman (14.6%, a difference of 1.7%), and Cajun (14.6%, a difference of 1.8%).
| Demographics | Rating | Rank | Disability |
| Navajo | 0.0 /100 | #330 | Tragic 14.3% |
| Alaskan Athabascans | 0.0 /100 | #331 | Tragic 14.4% |
| Pueblo | 0.0 /100 | #332 | Tragic 14.4% |
| Cajuns | 0.0 /100 | #333 | Tragic 14.6% |
| Yuman | 0.0 /100 | #334 | Tragic 14.6% |
| Tohono O'odham | 0.0 /100 | #335 | Tragic 14.8% |
| Cherokee | 0.0 /100 | #336 | Tragic 14.8% |
| Seminole | 0.0 /100 | #337 | Tragic 14.9% |
| Dutch West Indians | 0.0 /100 | #338 | Tragic 14.9% |
| Chickasaw | 0.0 /100 | #339 | Tragic 15.2% |
| Choctaw | 0.0 /100 | #340 | Tragic 15.4% |
| Lumbee | 0.0 /100 | #341 | Tragic 15.5% |
| Kiowa | 0.0 /100 | #342 | Tragic 15.6% |
| Creek | 0.0 /100 | #343 | Tragic 15.6% |
| Colville | 0.0 /100 | #344 | Tragic 15.8% |
Demographics Similar to Laotians by Disability
In terms of disability, the demographic groups most similar to Laotians are Bulgarian (11.0%, a difference of 0.010%), Immigrants from Sweden (11.0%, a difference of 0.030%), Colombian (11.0%, a difference of 0.080%), Immigrants from Afghanistan (11.0%, a difference of 0.20%), and Immigrants from Eritrea (11.0%, a difference of 0.21%).
| Demographics | Rating | Rank | Disability |
| Immigrants | Colombia | 99.7 /100 | #59 | Exceptional 10.9% |
| Zimbabweans | 99.7 /100 | #60 | Exceptional 10.9% |
| Immigrants | Bulgaria | 99.7 /100 | #61 | Exceptional 10.9% |
| Immigrants | Northern Africa | 99.7 /100 | #62 | Exceptional 10.9% |
| Immigrants | Eritrea | 99.7 /100 | #63 | Exceptional 11.0% |
| Immigrants | Sweden | 99.6 /100 | #64 | Exceptional 11.0% |
| Bulgarians | 99.6 /100 | #65 | Exceptional 11.0% |
| Laotians | 99.6 /100 | #66 | Exceptional 11.0% |
| Colombians | 99.6 /100 | #67 | Exceptional 11.0% |
| Immigrants | Afghanistan | 99.6 /100 | #68 | Exceptional 11.0% |
| Sri Lankans | 99.5 /100 | #69 | Exceptional 11.0% |
| Immigrants | France | 99.4 /100 | #70 | Exceptional 11.0% |
| Immigrants | Lebanon | 99.4 /100 | #71 | Exceptional 11.0% |
| Immigrants | Chile | 99.4 /100 | #72 | Exceptional 11.0% |
| Immigrants | Bangladesh | 99.4 /100 | #73 | Exceptional 11.0% |