Seminole vs Immigrants from Argentina In Labor Force | Age 25-29

COMPARE

Seminole
Race
Ancestry
AfghanAfricanAlaska NativeAlaskan AthabascanAlbanianAleutAlsatianAmericanApacheArabArapahoArgentineanArmenianAssyrian/Chaldean/SyriacAustralianAustrianBahamianBangladeshiBarbadianBasqueBelgianBelizeanBermudanBhutaneseBlackfeetBolivianBrazilianBritishBritish West IndianBulgarianBurmeseCajunCambodianCanadianCape VerdeanCarpatho RusynCelticCentral AmericanCentral American IndianCherokeeCheyenneChickasawChileanChineseChippewaChoctawColombianColvilleComancheCosta RicanCreeCreekCroatianCrowCubanCypriotCzechCzechoslovakianDanishDelawareDominicanDutchDutch West IndianEastern EuropeanEcuadorianEgyptianEnglishEstonianEthiopianEuropeanFijianFilipinoFinnishFrenchFrench American IndianFrench CanadianGermanGerman RussianGhanaianGreekGuamanian/ChamorroGuatemalanGuyaneseHaitianHmongHonduranHopiHoumaHungarianIcelanderIndian (Asian)IndonesianInupiatIranianIraqiIrishIroquoisIsraeliItalianJamaicanJapaneseJordanianKenyanKiowaKoreanLaotianLatvianLebaneseLiberianLithuanianLumbeeLuxembourgerMacedonianMalaysianMalteseMarshalleseMenomineeMexicanMexican American IndianMongolianMoroccanNative HawaiianNavajoNepaleseNew ZealanderNicaraguanNigerianNorthern EuropeanNorwegianOkinawanOsageOttawaPaiutePakistaniPalestinianPanamanianParaguayanPennsylvania GermanPeruvianPimaPolishPortuguesePotawatomiPuebloPuerto RicanPuget Sound SalishRomanianRussianSalvadoranSamoanScandinavianScotch-IrishScottishSeminoleSenegaleseSerbianShoshoneSierra LeoneanSiouxSlavicSlovakSloveneSomaliSouth AfricanSouth AmericanSouth American IndianSoviet UnionSpaniardSpanishSpanish AmericanSpanish American IndianSri LankanSubsaharan AfricanSudaneseSwedishSwissSyrianTaiwaneseThaiTlingit-HaidaTohono O'OdhamTonganTrinidadian and TobagonianTsimshianTurkishU.S. Virgin IslanderUgandanUkrainianUruguayanUteVenezuelanVietnameseWelshWest IndianYakamaYaquiYugoslavianYumanYup'ikZimbabwean
Immigration
NonimmigrantsImmigrantsAfghanistanAfricaAlbaniaArmeniaAsiaAustraliaAustriaBahamasBangladeshBarbadosBelarusBelgiumBelizeBoliviaBosnia and HerzegovinaBrazilBulgariaBurma/MyanmarCabo VerdeCambodiaCameroonCanadaCaribbeanCentral AmericaChileChinaColombiaCongoCosta RicaCroatiaCubaCzechoslovakiaDenmarkDominicaDominican RepublicEastern AfricaEastern AsiaEastern EuropeEcuadorEgyptEl SalvadorEnglandEritreaEthiopiaEuropeFijiFranceGermanyGhanaGreeceGrenadaGuatemalaGuyanaHaitiHondurasHong KongHungaryIndiaIndonesiaIranIraqIrelandIsraelItalyJamaicaJapanJordanKazakhstanKenyaKoreaKuwaitLaosLatin AmericaLatviaLebanonLiberiaLithuaniaMalaysiaMexicoMicronesiaMiddle AfricaMoldovaMoroccoNepalNetherlandsNicaraguaNigeriaNorth AmericaNorth MacedoniaNorthern AfricaNorthern EuropeNorwayOceaniaPakistanPanamaPeruPhilippinesPolandPortugalRomaniaRussiaSaudi ArabiaScotlandSenegalSerbiaSierra LeoneSingaporeSomaliaSouth AfricaSouth AmericaSouth Central AsiaSouth Eastern AsiaSouthern EuropeSpainSri LankaSt. Vincent and the GrenadinesSudanSwedenSwitzerlandSyriaTaiwanThailandTrinidad and TobagoTurkeyUgandaUkraineUruguayUzbekistanVenezuelaVietnamWest IndiesWestern AfricaWestern AsiaWestern EuropeYemenZaireZimbabweAzores
Immigrants from Argentina
Race
Ancestry
AfghanAfricanAlaska NativeAlaskan AthabascanAlbanianAleutAlsatianAmericanApacheArabArapahoArgentineanArmenianAssyrian/Chaldean/SyriacAustralianAustrianBahamianBangladeshiBarbadianBasqueBelgianBelizeanBermudanBhutaneseBlackfeetBolivianBrazilianBritishBritish West IndianBulgarianBurmeseCajunCambodianCanadianCape VerdeanCarpatho RusynCelticCentral AmericanCentral American IndianCherokeeCheyenneChickasawChileanChineseChippewaChoctawColombianColvilleComancheCosta RicanCreeCreekCroatianCrowCubanCypriotCzechCzechoslovakianDanishDelawareDominicanDutchDutch West IndianEastern EuropeanEcuadorianEgyptianEnglishEstonianEthiopianEuropeanFijianFilipinoFinnishFrenchFrench American IndianFrench CanadianGermanGerman RussianGhanaianGreekGuamanian/ChamorroGuatemalanGuyaneseHaitianHmongHonduranHopiHoumaHungarianIcelanderIndian (Asian)IndonesianInupiatIranianIraqiIrishIroquoisIsraeliItalianJamaicanJapaneseJordanianKenyanKiowaKoreanLaotianLatvianLebaneseLiberianLithuanianLumbeeLuxembourgerMacedonianMalaysianMalteseMarshalleseMenomineeMexicanMexican American IndianMongolianMoroccanNative HawaiianNavajoNepaleseNew ZealanderNicaraguanNigerianNorthern EuropeanNorwegianOkinawanOsageOttawaPaiutePakistaniPalestinianPanamanianParaguayanPennsylvania GermanPeruvianPimaPolishPortuguesePotawatomiPuebloPuerto RicanPuget Sound SalishRomanianRussianSalvadoranSamoanScandinavianScotch-IrishScottishSenegaleseSerbianShoshoneSierra LeoneanSiouxSlavicSlovakSloveneSomaliSouth AfricanSouth AmericanSouth American IndianSoviet UnionSpaniardSpanishSpanish AmericanSpanish American IndianSri LankanSubsaharan AfricanSudaneseSwedishSwissSyrianTaiwaneseThaiTlingit-HaidaTohono O'OdhamTonganTrinidadian and TobagonianTsimshianTurkishU.S. Virgin IslanderUgandanUkrainianUruguayanUteVenezuelanVietnameseWelshWest IndianYakamaYaquiYugoslavianYumanYup'ikZimbabwean
Immigration
NonimmigrantsImmigrantsAfghanistanAfricaAlbaniaArgentinaArmeniaAsiaAustraliaAustriaBahamasBangladeshBarbadosBelarusBelgiumBelizeBoliviaBosnia and HerzegovinaBrazilBulgariaBurma/MyanmarCabo VerdeCambodiaCameroonCanadaCaribbeanCentral AmericaChileChinaColombiaCongoCosta RicaCroatiaCubaCzechoslovakiaDenmarkDominicaDominican RepublicEastern AfricaEastern AsiaEastern EuropeEcuadorEgyptEl SalvadorEnglandEritreaEthiopiaEuropeFijiFranceGermanyGhanaGreeceGrenadaGuatemalaGuyanaHaitiHondurasHong KongHungaryIndiaIndonesiaIranIraqIrelandIsraelItalyJamaicaJapanJordanKazakhstanKenyaKoreaKuwaitLaosLatin AmericaLatviaLebanonLiberiaLithuaniaMalaysiaMexicoMicronesiaMiddle AfricaMoldovaMoroccoNepalNetherlandsNicaraguaNigeriaNorth AmericaNorth MacedoniaNorthern AfricaNorthern EuropeNorwayOceaniaPakistanPanamaPeruPhilippinesPolandPortugalRomaniaRussiaSaudi ArabiaScotlandSenegalSerbiaSierra LeoneSingaporeSomaliaSouth AfricaSouth AmericaSouth Central AsiaSouth Eastern AsiaSouthern EuropeSpainSri LankaSt. Vincent and the GrenadinesSudanSwedenSwitzerlandSyriaTaiwanThailandTrinidad and TobagoTurkeyUgandaUkraineUruguayUzbekistanVenezuelaVietnamWest IndiesWestern AfricaWestern AsiaWestern EuropeYemenZaireZimbabweAzores
In Labor Force | Age 25-29
Income
Poverty
Unemployment
Labor Participation
Family Structure
Vehicle Availability
Education Level
Disability

In Labor Force | Age 25-29 Comparison

Seminole

Immigrants from Argentina

Tragic
Average
81.7%
IN LABOR FORCE | AGE 25-29
0.0/ 100
METRIC RATING
319th/ 347
METRIC RANK
84.6%
IN LABOR FORCE | AGE 25-29
44.0/ 100
METRIC RATING
179th/ 347
METRIC RANK

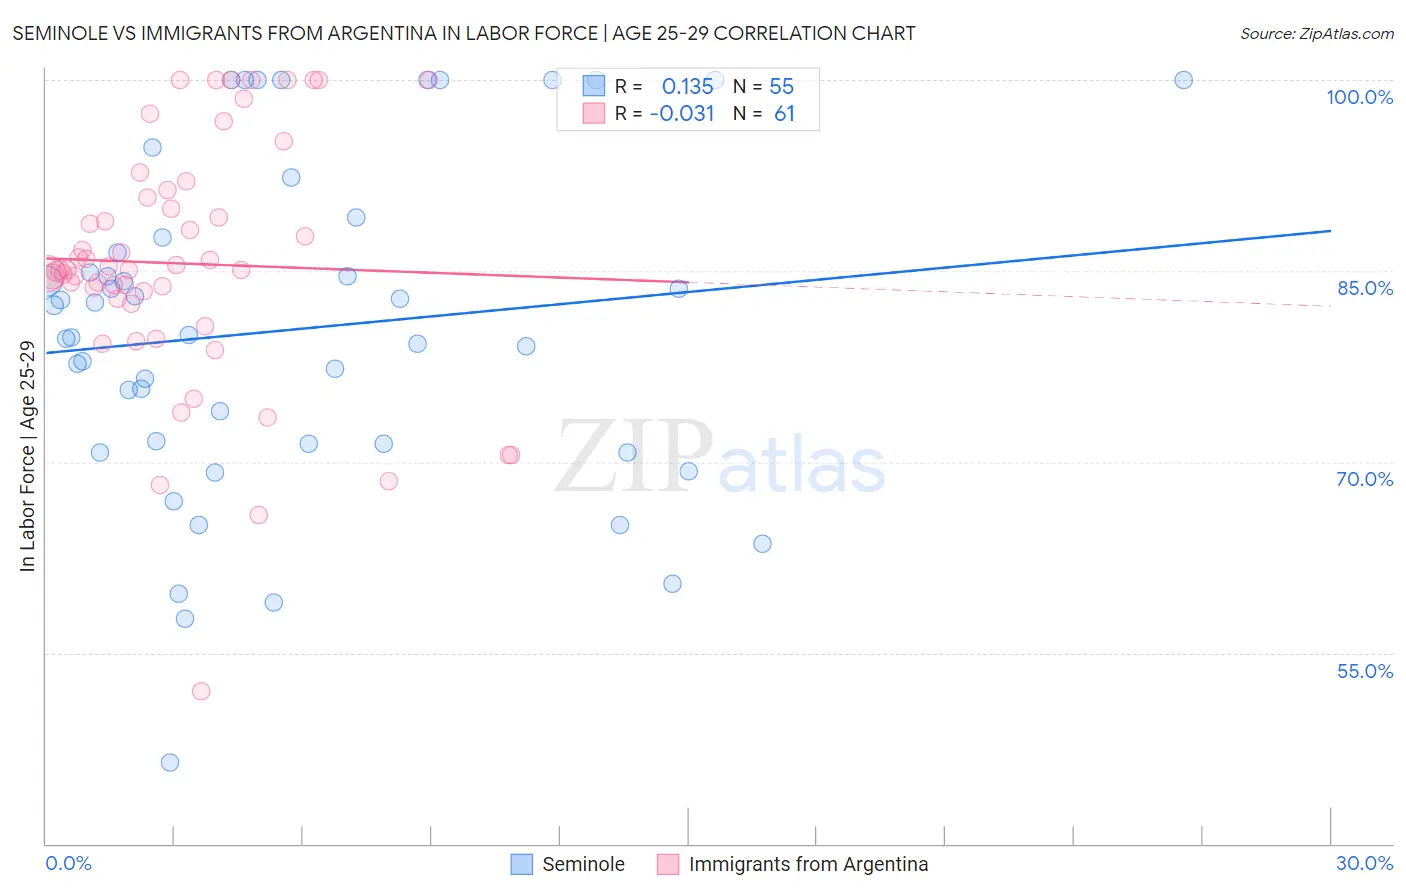
Seminole vs Immigrants from Argentina In Labor Force | Age 25-29 Correlation Chart

The statistical analysis conducted on geographies consisting of 118,300,906 people shows a poor positive correlation between the proportion of Seminole and labor force participation rate among population between the ages 25 and 29 in the United States with a correlation coefficient (R) of 0.135 and weighted average of 81.7%. Similarly, the statistical analysis conducted on geographies consisting of 264,395,747 people shows no correlation between the proportion of Immigrants from Argentina and labor force participation rate among population between the ages 25 and 29 in the United States with a correlation coefficient (R) of -0.031 and weighted average of 84.6%, a difference of 3.6%.
Seminole vs Immigrants from Argentina In Labor Force | Age 25-29

In Labor Force | Age 25-29 Correlation Summary

MeasurementSeminoleImmigrants from Argentina
Minimum46.3%52.0%
Maximum100.0%100.0%
Range53.7%48.0%
Mean80.4%85.6%
Median80.0%85.1%
Interquartile 25% (IQ1)71.4%82.7%
Interquartile 75% (IQ3)87.6%91.1%
Interquartile Range (IQR)16.2%8.4%
Standard Deviation (Sample)13.0%9.7%
Standard Deviation (Population)12.9%9.6%

Similar Demographics by In Labor Force | Age 25-29

Demographics Similar to Seminole by In Labor Force | Age 25-29

In terms of in labor force | age 25-29, the demographic groups most similar to Seminole are Colville (81.6%, a difference of 0.050%), Shoshone (81.6%, a difference of 0.11%), Kiowa (81.6%, a difference of 0.12%), Alaska Native (81.6%, a difference of 0.16%), and Comanche (81.9%, a difference of 0.22%).
DemographicsRating | RankIn Labor Force | Age 25-29
Hispanics or Latinos
0.0
/100
|
#312
Tragic
82.2%
Yaqui
0.0
/100
|
#313
Tragic
82.2%
Cherokee
0.0
/100
|
#314
Tragic
82.1%
Immigrants | Mexico
0.0
/100
|
#315
Tragic
82.0%
Mexicans
0.0
/100
|
#316
Tragic
81.9%
Chickasaw
0.0
/100
|
#317
Tragic
81.9%
Comanche
0.0
/100
|
#318
Tragic
81.9%
Seminole
0.0
/100
|
#319
Tragic
81.7%
Colville
0.0
/100
|
#320
Tragic
81.6%
Shoshone
0.0
/100
|
#321
Tragic
81.6%
Kiowa
0.0
/100
|
#322
Tragic
81.6%
Alaska Natives
0.0
/100
|
#323
Tragic
81.6%
Houma
0.0
/100
|
#324
Tragic
81.2%
Dutch West Indians
0.0
/100
|
#325
Tragic
81.1%
Choctaw
0.0
/100
|
#326
Tragic
81.0%

Demographics Similar to Immigrants from Argentina by In Labor Force | Age 25-29

In terms of in labor force | age 25-29, the demographic groups most similar to Immigrants from Argentina are Immigrants from China (84.6%, a difference of 0.010%), Immigrants from Thailand (84.6%, a difference of 0.010%), Immigrants from South America (84.6%, a difference of 0.010%), Malaysian (84.6%, a difference of 0.020%), and Immigrants from Norway (84.6%, a difference of 0.020%).
DemographicsRating | RankIn Labor Force | Age 25-29
Immigrants | Western Europe
50.4
/100
|
#172
Average
84.7%
Assyrians/Chaldeans/Syriacs
50.2
/100
|
#173
Average
84.7%
Palestinians
50.0
/100
|
#174
Average
84.7%
Hungarians
47.8
/100
|
#175
Average
84.6%
Malaysians
46.8
/100
|
#176
Average
84.6%
Immigrants | China
45.7
/100
|
#177
Average
84.6%
Immigrants | Thailand
45.2
/100
|
#178
Average
84.6%
Immigrants | Argentina
44.0
/100
|
#179
Average
84.6%
Immigrants | South America
42.9
/100
|
#180
Average
84.6%
Immigrants | Norway
41.9
/100
|
#181
Average
84.6%
Europeans
40.3
/100
|
#182
Average
84.6%
Scottish
40.1
/100
|
#183
Average
84.6%
Immigrants | Kuwait
38.2
/100
|
#184
Fair
84.6%
Immigrants | Denmark
37.0
/100
|
#185
Fair
84.6%
Immigrants | Belgium
35.0
/100
|
#186
Fair
84.6%