Greek vs Potawatomi Disability Age Over 75
COMPARE
Greek
Potawatomi
Disability Age Over 75
Disability Age Over 75 Comparison
Greeks
Potawatomi
45.6%
DISABILITY AGE OVER 75
99.8/ 100
METRIC RATING
42nd/ 347
METRIC RANK
49.0%
DISABILITY AGE OVER 75
0.2/ 100
METRIC RATING
270th/ 347
METRIC RANK
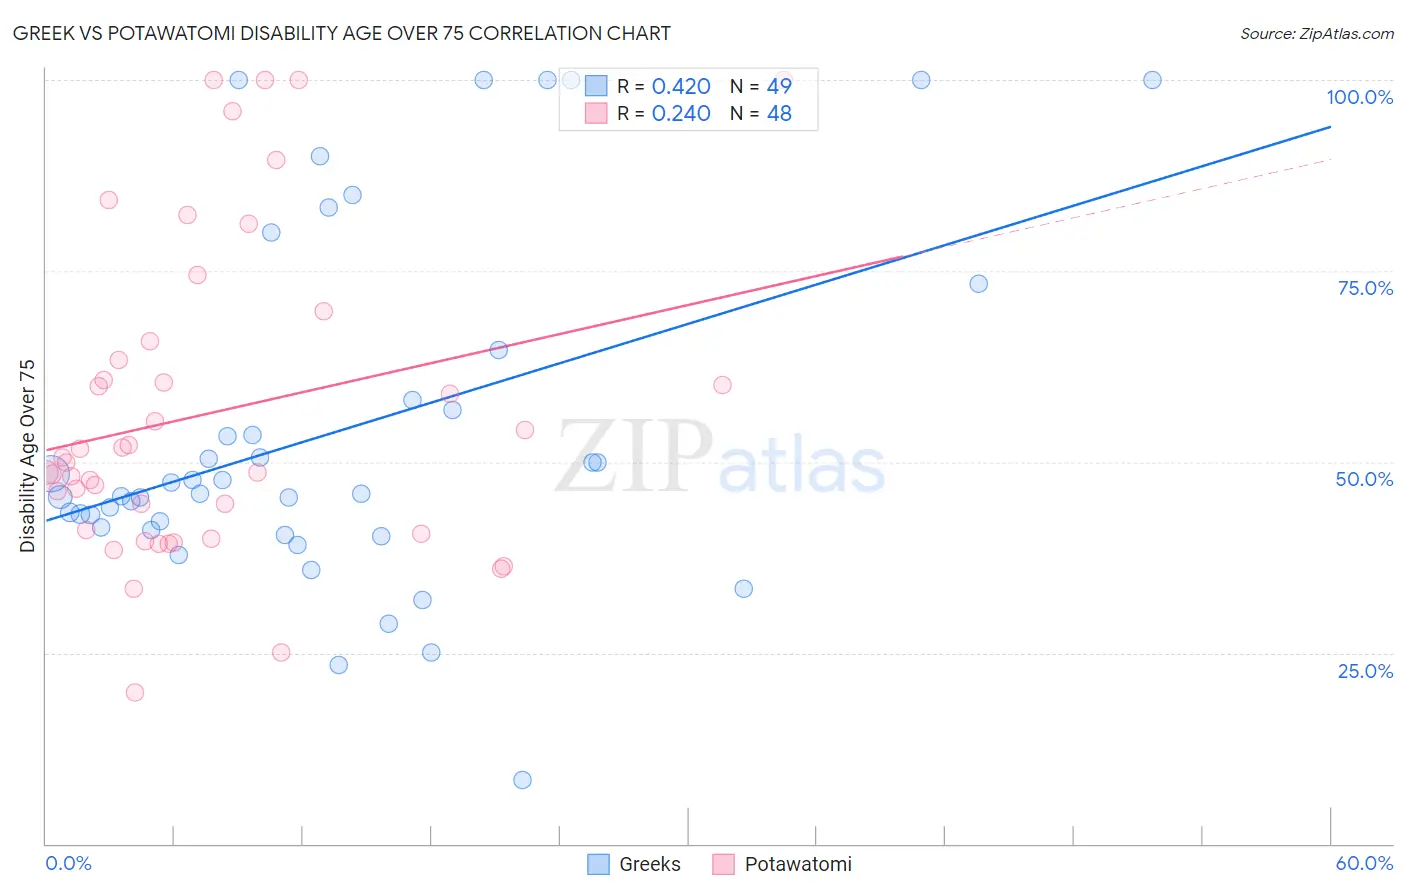
Greek vs Potawatomi Disability Age Over 75 Correlation Chart
The statistical analysis conducted on geographies consisting of 481,666,477 people shows a moderate positive correlation between the proportion of Greeks and percentage of population with a disability over the age of 75 in the United States with a correlation coefficient (R) of 0.420 and weighted average of 45.6%. Similarly, the statistical analysis conducted on geographies consisting of 117,704,790 people shows a weak positive correlation between the proportion of Potawatomi and percentage of population with a disability over the age of 75 in the United States with a correlation coefficient (R) of 0.240 and weighted average of 49.0%, a difference of 7.4%.
Disability Age Over 75 Correlation Summary
| Measurement | Greek | Potawatomi |
| Minimum | 8.3% | 19.8% |
| Maximum | 100.0% | 100.0% |
| Range | 91.7% | 80.2% |
| Mean | 54.1% | 56.5% |
| Median | 45.8% | 50.3% |
| Interquartile 25% (IQ1) | 41.2% | 40.8% |
| Interquartile 75% (IQ3) | 61.4% | 64.6% |
| Interquartile Range (IQR) | 20.2% | 23.8% |
| Standard Deviation (Sample) | 22.9% | 20.6% |
| Standard Deviation (Population) | 22.7% | 20.4% |
Similar Demographics by Disability Age Over 75
Demographics Similar to Greeks by Disability Age Over 75
In terms of disability age over 75, the demographic groups most similar to Greeks are Czech (45.7%, a difference of 0.0%), Immigrants from Singapore (45.6%, a difference of 0.040%), Australian (45.7%, a difference of 0.040%), Turkish (45.7%, a difference of 0.040%), and Swedish (45.7%, a difference of 0.070%).
| Demographics | Rating | Rank | Disability Age Over 75 |
| Norwegians | 99.9 /100 | #35 | Exceptional 45.5% |
| Immigrants | Taiwan | 99.9 /100 | #36 | Exceptional 45.5% |
| South Africans | 99.9 /100 | #37 | Exceptional 45.5% |
| Italians | 99.9 /100 | #38 | Exceptional 45.6% |
| Estonians | 99.9 /100 | #39 | Exceptional 45.6% |
| Slovenes | 99.9 /100 | #40 | Exceptional 45.6% |
| Immigrants | Singapore | 99.8 /100 | #41 | Exceptional 45.6% |
| Greeks | 99.8 /100 | #42 | Exceptional 45.6% |
| Czechs | 99.8 /100 | #43 | Exceptional 45.7% |
| Australians | 99.8 /100 | #44 | Exceptional 45.7% |
| Turks | 99.8 /100 | #45 | Exceptional 45.7% |
| Swedes | 99.8 /100 | #46 | Exceptional 45.7% |
| Immigrants | Canada | 99.8 /100 | #47 | Exceptional 45.7% |
| Croatians | 99.8 /100 | #48 | Exceptional 45.7% |
| Immigrants | North America | 99.8 /100 | #49 | Exceptional 45.7% |
Demographics Similar to Potawatomi by Disability Age Over 75
In terms of disability age over 75, the demographic groups most similar to Potawatomi are Fijian (49.0%, a difference of 0.020%), Immigrants from El Salvador (49.0%, a difference of 0.030%), Assyrian/Chaldean/Syriac (49.1%, a difference of 0.030%), Guatemalan (49.0%, a difference of 0.050%), and Malaysian (49.0%, a difference of 0.060%).
| Demographics | Rating | Rank | Disability Age Over 75 |
| Salvadorans | 0.3 /100 | #263 | Tragic 48.9% |
| Immigrants | Honduras | 0.3 /100 | #264 | Tragic 48.9% |
| Hondurans | 0.3 /100 | #265 | Tragic 48.9% |
| U.S. Virgin Islanders | 0.2 /100 | #266 | Tragic 48.9% |
| Malaysians | 0.2 /100 | #267 | Tragic 49.0% |
| Guatemalans | 0.2 /100 | #268 | Tragic 49.0% |
| Immigrants | El Salvador | 0.2 /100 | #269 | Tragic 49.0% |
| Potawatomi | 0.2 /100 | #270 | Tragic 49.0% |
| Fijians | 0.2 /100 | #271 | Tragic 49.0% |
| Assyrians/Chaldeans/Syriacs | 0.2 /100 | #272 | Tragic 49.1% |
| Immigrants | Iraq | 0.1 /100 | #273 | Tragic 49.1% |
| Immigrants | Guatemala | 0.1 /100 | #274 | Tragic 49.1% |
| Immigrants | Dominica | 0.1 /100 | #275 | Tragic 49.1% |
| Immigrants | Uzbekistan | 0.1 /100 | #276 | Tragic 49.2% |
| Hawaiians | 0.1 /100 | #277 | Tragic 49.2% |