Samoan vs Lebanese Disability Age Over 75

COMPARE

Samoan
Race
Ancestry
AfghanAfricanAlaska NativeAlaskan AthabascanAlbanianAleutAlsatianAmericanApacheArabArapahoArgentineanArmenianAssyrian/Chaldean/SyriacAustralianAustrianBahamianBangladeshiBarbadianBasqueBelgianBelizeanBermudanBhutaneseBlackfeetBolivianBrazilianBritishBritish West IndianBulgarianBurmeseCajunCambodianCanadianCape VerdeanCarpatho RusynCelticCentral AmericanCentral American IndianCherokeeCheyenneChickasawChileanChineseChippewaChoctawColombianColvilleComancheCosta RicanCreeCreekCroatianCrowCubanCypriotCzechCzechoslovakianDanishDelawareDominicanDutchDutch West IndianEastern EuropeanEcuadorianEgyptianEnglishEstonianEthiopianEuropeanFijianFilipinoFinnishFrenchFrench American IndianFrench CanadianGermanGerman RussianGhanaianGreekGuamanian/ChamorroGuatemalanGuyaneseHaitianHmongHonduranHopiHoumaHungarianIcelanderIndian (Asian)IndonesianInupiatIranianIraqiIrishIroquoisIsraeliItalianJamaicanJapaneseJordanianKenyanKiowaKoreanLaotianLatvianLiberianLithuanianLumbeeLuxembourgerMacedonianMalaysianMalteseMarshalleseMenomineeMexicanMexican American IndianMongolianMoroccanNative HawaiianNavajoNepaleseNew ZealanderNicaraguanNigerianNorthern EuropeanNorwegianOkinawanOsageOttawaPaiutePakistaniPalestinianPanamanianParaguayanPennsylvania GermanPeruvianPimaPolishPortuguesePotawatomiPuebloPuerto RicanPuget Sound SalishRomanianRussianSalvadoranSamoanScandinavianScotch-IrishScottishSeminoleSenegaleseSerbianShoshoneSierra LeoneanSiouxSlavicSlovakSloveneSomaliSouth AfricanSouth AmericanSouth American IndianSoviet UnionSpaniardSpanishSpanish AmericanSpanish American IndianSri LankanSubsaharan AfricanSudaneseSwedishSwissSyrianTaiwaneseThaiTlingit-HaidaTohono O'OdhamTonganTrinidadian and TobagonianTsimshianTurkishU.S. Virgin IslanderUgandanUkrainianUruguayanUteVenezuelanVietnameseWelshWest IndianYakamaYaquiYugoslavianYumanYup'ikZimbabwean
Immigration
NonimmigrantsImmigrantsAfghanistanAfricaAlbaniaArgentinaArmeniaAsiaAustraliaAustriaBahamasBangladeshBarbadosBelarusBelgiumBelizeBoliviaBosnia and HerzegovinaBrazilBulgariaBurma/MyanmarCabo VerdeCambodiaCameroonCanadaCaribbeanCentral AmericaChileChinaColombiaCongoCosta RicaCroatiaCubaCzechoslovakiaDenmarkDominicaDominican RepublicEastern AfricaEastern AsiaEastern EuropeEcuadorEgyptEl SalvadorEnglandEritreaEthiopiaEuropeFijiFranceGermanyGhanaGreeceGrenadaGuatemalaGuyanaHaitiHondurasHong KongHungaryIndiaIndonesiaIranIraqIrelandIsraelItalyJamaicaJapanJordanKazakhstanKenyaKoreaKuwaitLaosLatin AmericaLatviaLebanonLiberiaLithuaniaMalaysiaMexicoMicronesiaMiddle AfricaMoldovaMoroccoNepalNetherlandsNicaraguaNigeriaNorth AmericaNorth MacedoniaNorthern AfricaNorthern EuropeNorwayOceaniaPakistanPanamaPeruPhilippinesPolandPortugalRomaniaRussiaSaudi ArabiaScotlandSenegalSerbiaSierra LeoneSingaporeSomaliaSouth AfricaSouth AmericaSouth Central AsiaSouth Eastern AsiaSouthern EuropeSpainSri LankaSt. Vincent and the GrenadinesSudanSwedenSwitzerlandSyriaTaiwanThailandTrinidad and TobagoTurkeyUgandaUkraineUruguayUzbekistanVenezuelaVietnamWest IndiesWestern AfricaWestern AsiaWestern EuropeYemenZaireZimbabweAzores
Lebanese
Race
Ancestry
AfghanAfricanAlaska NativeAlaskan AthabascanAlbanianAleutAlsatianAmericanApacheArabArapahoArgentineanArmenianAssyrian/Chaldean/SyriacAustralianAustrianBahamianBangladeshiBarbadianBasqueBelgianBelizeanBermudanBhutaneseBlackfeetBolivianBrazilianBritishBritish West IndianBulgarianBurmeseCajunCambodianCanadianCape VerdeanCarpatho RusynCelticCentral AmericanCentral American IndianCherokeeCheyenneChickasawChileanChineseChippewaChoctawColombianColvilleComancheCosta RicanCreeCreekCroatianCrowCubanCypriotCzechCzechoslovakianDanishDelawareDominicanDutchDutch West IndianEastern EuropeanEcuadorianEgyptianEnglishEstonianEthiopianEuropeanFijianFilipinoFinnishFrenchFrench American IndianFrench CanadianGermanGerman RussianGhanaianGreekGuamanian/ChamorroGuatemalanGuyaneseHaitianHmongHonduranHopiHoumaHungarianIcelanderIndian (Asian)IndonesianInupiatIranianIraqiIrishIroquoisIsraeliItalianJamaicanJapaneseJordanianKenyanKiowaKoreanLaotianLatvianLebaneseLiberianLithuanianLumbeeLuxembourgerMacedonianMalaysianMalteseMarshalleseMenomineeMexicanMexican American IndianMongolianMoroccanNative HawaiianNavajoNepaleseNew ZealanderNicaraguanNigerianNorthern EuropeanNorwegianOkinawanOsageOttawaPaiutePakistaniPalestinianPanamanianParaguayanPennsylvania GermanPeruvianPimaPolishPortuguesePotawatomiPuebloPuerto RicanPuget Sound SalishRomanianRussianSalvadoranScandinavianScotch-IrishScottishSeminoleSenegaleseSerbianShoshoneSierra LeoneanSiouxSlavicSlovakSloveneSomaliSouth AfricanSouth AmericanSouth American IndianSoviet UnionSpaniardSpanishSpanish AmericanSpanish American IndianSri LankanSubsaharan AfricanSudaneseSwedishSwissSyrianTaiwaneseThaiTlingit-HaidaTohono O'OdhamTonganTrinidadian and TobagonianTsimshianTurkishU.S. Virgin IslanderUgandanUkrainianUruguayanUteVenezuelanVietnameseWelshWest IndianYakamaYaquiYugoslavianYumanYup'ikZimbabwean
Immigration
NonimmigrantsImmigrantsAfghanistanAfricaAlbaniaArgentinaArmeniaAsiaAustraliaAustriaBahamasBangladeshBarbadosBelarusBelgiumBelizeBoliviaBosnia and HerzegovinaBrazilBulgariaBurma/MyanmarCabo VerdeCambodiaCameroonCanadaCaribbeanCentral AmericaChileChinaColombiaCongoCosta RicaCroatiaCubaCzechoslovakiaDenmarkDominicaDominican RepublicEastern AfricaEastern AsiaEastern EuropeEcuadorEgyptEl SalvadorEnglandEritreaEthiopiaEuropeFijiFranceGermanyGhanaGreeceGrenadaGuatemalaGuyanaHaitiHondurasHong KongHungaryIndiaIndonesiaIranIraqIrelandIsraelItalyJamaicaJapanJordanKazakhstanKenyaKoreaKuwaitLaosLatin AmericaLatviaLebanonLiberiaLithuaniaMalaysiaMexicoMicronesiaMiddle AfricaMoldovaMoroccoNepalNetherlandsNicaraguaNigeriaNorth AmericaNorth MacedoniaNorthern AfricaNorthern EuropeNorwayOceaniaPakistanPanamaPeruPhilippinesPolandPortugalRomaniaRussiaSaudi ArabiaScotlandSenegalSerbiaSierra LeoneSingaporeSomaliaSouth AfricaSouth AmericaSouth Central AsiaSouth Eastern AsiaSouthern EuropeSpainSri LankaSt. Vincent and the GrenadinesSudanSwedenSwitzerlandSyriaTaiwanThailandTrinidad and TobagoTurkeyUgandaUkraineUruguayUzbekistanVenezuelaVietnamWest IndiesWestern AfricaWestern AsiaWestern EuropeYemenZaireZimbabweAzores
Disability Age Over 75
Income
Poverty
Unemployment
Labor Participation
Family Structure
Vehicle Availability
Education Level
Disability

Disability Age Over 75 Comparison

Samoans

Lebanese

Tragic
Excellent
49.5%
DISABILITY AGE OVER 75
0.0/ 100
METRIC RATING
283rd/ 347
METRIC RANK
46.8%
DISABILITY AGE OVER 75
87.0/ 100
METRIC RATING
141st/ 347
METRIC RANK

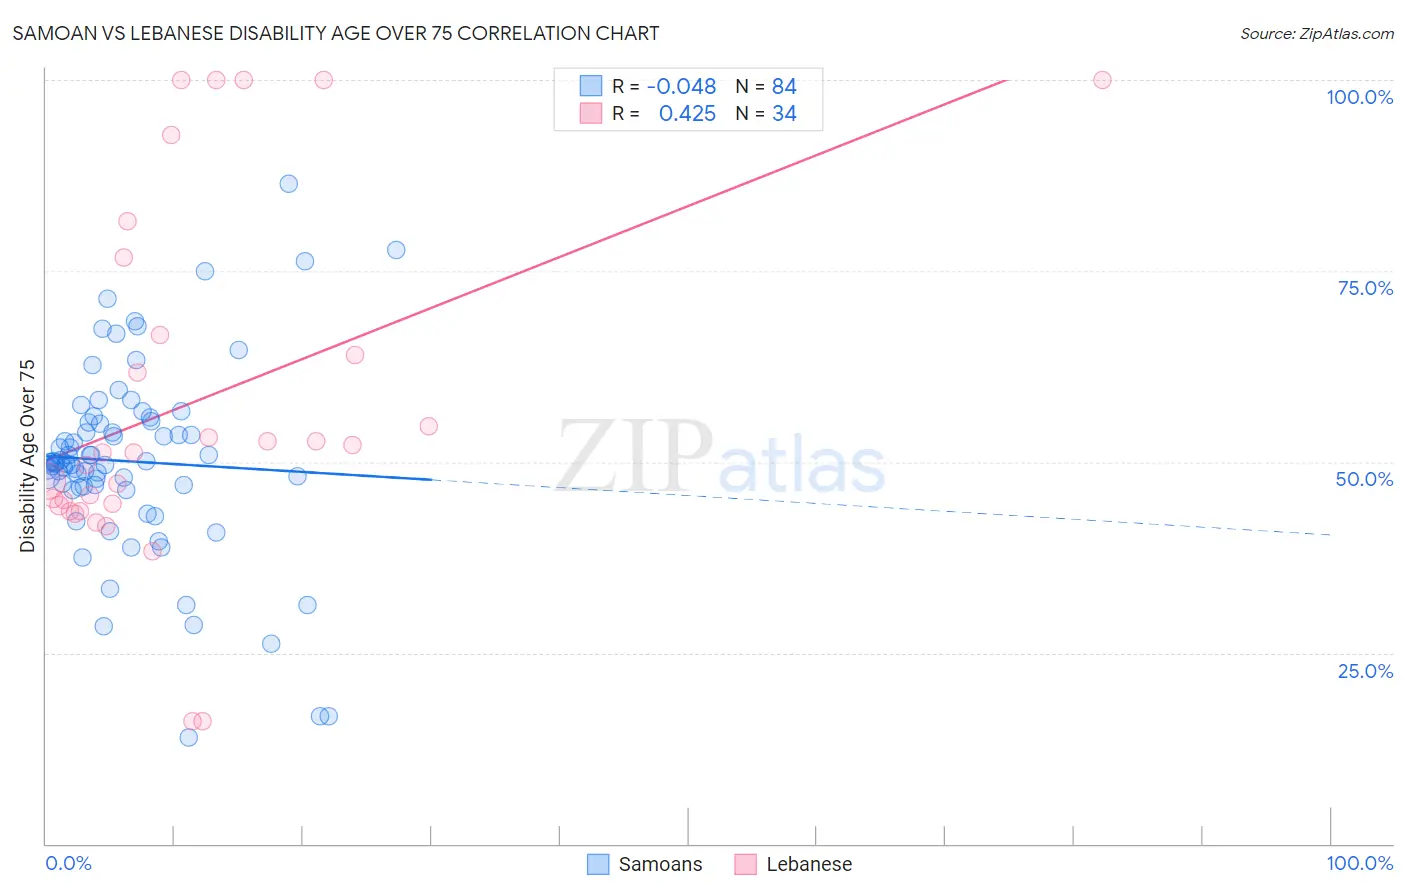
Samoan vs Lebanese Disability Age Over 75 Correlation Chart

The statistical analysis conducted on geographies consisting of 224,696,097 people shows no correlation between the proportion of Samoans and percentage of population with a disability over the age of 75 in the United States with a correlation coefficient (R) of -0.048 and weighted average of 49.5%. Similarly, the statistical analysis conducted on geographies consisting of 400,844,308 people shows a moderate positive correlation between the proportion of Lebanese and percentage of population with a disability over the age of 75 in the United States with a correlation coefficient (R) of 0.425 and weighted average of 46.8%, a difference of 5.7%.
Samoan vs Lebanese Disability Age Over 75

Disability Age Over 75 Correlation Summary

MeasurementSamoanLebanese
Minimum14.0%16.1%
Maximum86.4%100.0%
Range72.4%83.9%
Mean50.1%57.8%
Median49.9%51.2%
Interquartile 25% (IQ1)46.7%44.3%
Interquartile 75% (IQ3)55.2%66.7%
Interquartile Range (IQR)8.4%22.4%
Standard Deviation (Sample)12.6%23.0%
Standard Deviation (Population)12.5%22.7%

Similar Demographics by Disability Age Over 75

Demographics Similar to Samoans by Disability Age Over 75

In terms of disability age over 75, the demographic groups most similar to Samoans are Black/African American (49.5%, a difference of 0.030%), Immigrants from Latin America (49.5%, a difference of 0.050%), Bangladeshi (49.4%, a difference of 0.17%), Belizean (49.4%, a difference of 0.17%), and Crow (49.6%, a difference of 0.19%).
DemographicsRating | RankDisability Age Over 75
Immigrants | Uzbekistan
0.1
/100
|
#276
Tragic
49.2%
Hawaiians
0.1
/100
|
#277
Tragic
49.2%
Immigrants | Laos
0.1
/100
|
#278
Tragic
49.2%
Guamanians/Chamorros
0.0
/100
|
#279
Tragic
49.4%
Bangladeshis
0.0
/100
|
#280
Tragic
49.4%
Belizeans
0.0
/100
|
#281
Tragic
49.4%
Blacks/African Americans
0.0
/100
|
#282
Tragic
49.5%
Samoans
0.0
/100
|
#283
Tragic
49.5%
Immigrants | Latin America
0.0
/100
|
#284
Tragic
49.5%
Crow
0.0
/100
|
#285
Tragic
49.6%
Immigrants | Belize
0.0
/100
|
#286
Tragic
49.6%
Sioux
0.0
/100
|
#287
Tragic
49.7%
Yaqui
0.0
/100
|
#288
Tragic
49.8%
Osage
0.0
/100
|
#289
Tragic
49.8%
Puget Sound Salish
0.0
/100
|
#290
Tragic
49.8%

Demographics Similar to Lebanese by Disability Age Over 75

In terms of disability age over 75, the demographic groups most similar to Lebanese are Immigrants from Costa Rica (46.8%, a difference of 0.020%), Peruvian (46.8%, a difference of 0.020%), Bermudan (46.9%, a difference of 0.070%), Immigrants from Uganda (46.8%, a difference of 0.080%), and Immigrants from Bosnia and Herzegovina (46.8%, a difference of 0.080%).
DemographicsRating | RankDisability Age Over 75
Immigrants | Ethiopia
89.1
/100
|
#134
Excellent
46.8%
Ethiopians
88.9
/100
|
#135
Excellent
46.8%
Immigrants | Venezuela
88.6
/100
|
#136
Excellent
46.8%
Immigrants | Uganda
88.5
/100
|
#137
Excellent
46.8%
Immigrants | Bosnia and Herzegovina
88.5
/100
|
#138
Excellent
46.8%
Yugoslavians
88.5
/100
|
#139
Excellent
46.8%
Immigrants | Costa Rica
87.4
/100
|
#140
Excellent
46.8%
Lebanese
87.0
/100
|
#141
Excellent
46.8%
Peruvians
86.5
/100
|
#142
Excellent
46.8%
Bermudans
85.6
/100
|
#143
Excellent
46.9%
Venezuelans
85.0
/100
|
#144
Excellent
46.9%
Costa Ricans
84.5
/100
|
#145
Excellent
46.9%
Guyanese
84.3
/100
|
#146
Excellent
46.9%
Immigrants | Peru
84.1
/100
|
#147
Excellent
46.9%
Asians
81.6
/100
|
#148
Excellent
46.9%