Immigrants from Uzbekistan vs Sri Lankan Disability Age Over 75
COMPARE
Immigrants from Uzbekistan
Sri Lankan
Disability Age Over 75
Disability Age Over 75 Comparison
Immigrants from Uzbekistan
Sri Lankans
49.2%
DISABILITY AGE OVER 75
0.1/ 100
METRIC RATING
276th/ 347
METRIC RANK
48.5%
DISABILITY AGE OVER 75
1.4/ 100
METRIC RATING
248th/ 347
METRIC RANK
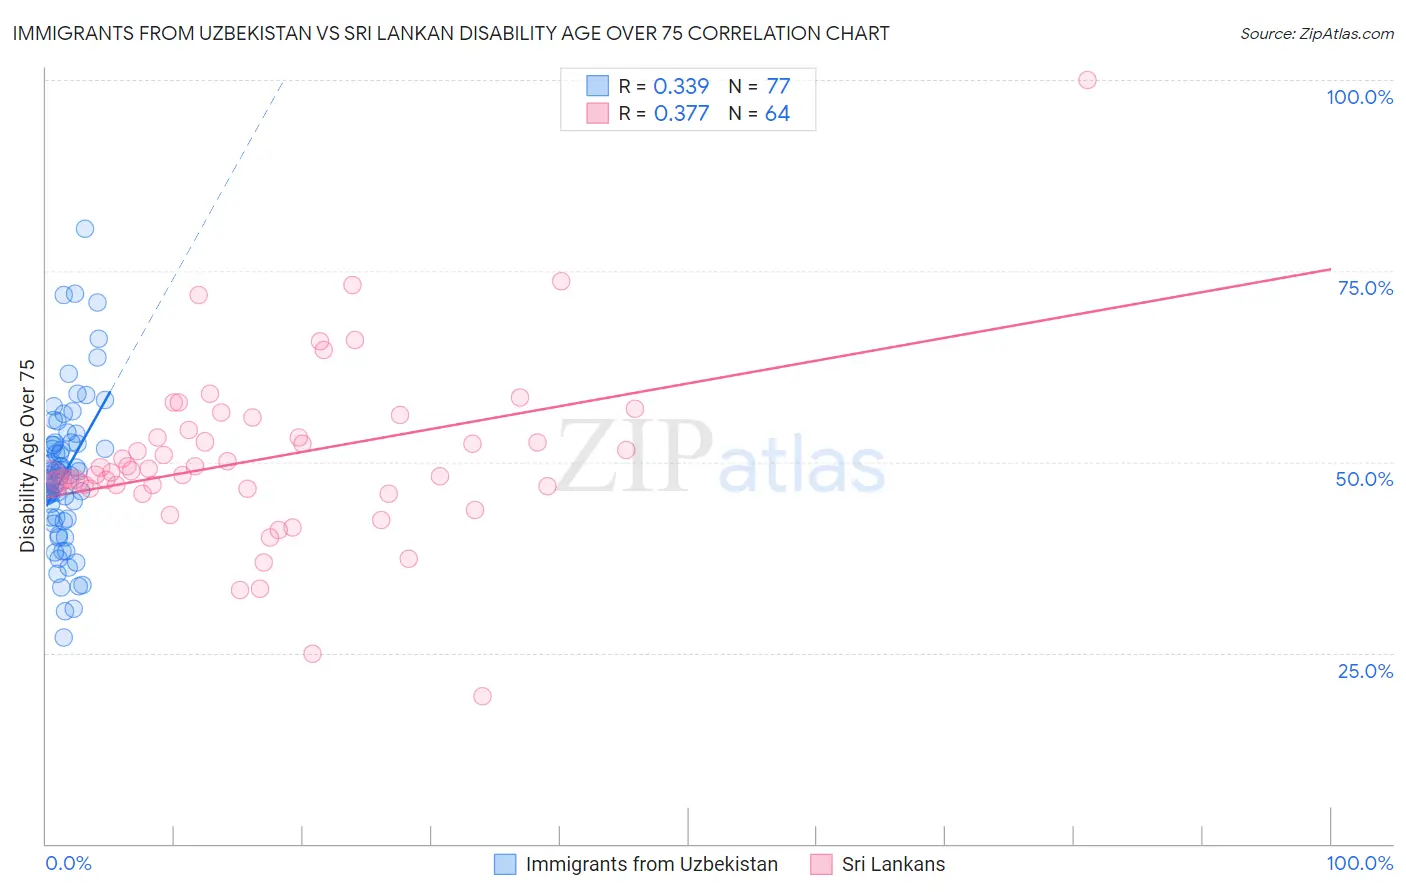
Immigrants from Uzbekistan vs Sri Lankan Disability Age Over 75 Correlation Chart
The statistical analysis conducted on geographies consisting of 118,571,316 people shows a mild positive correlation between the proportion of Immigrants from Uzbekistan and percentage of population with a disability over the age of 75 in the United States with a correlation coefficient (R) of 0.339 and weighted average of 49.2%. Similarly, the statistical analysis conducted on geographies consisting of 439,378,477 people shows a mild positive correlation between the proportion of Sri Lankans and percentage of population with a disability over the age of 75 in the United States with a correlation coefficient (R) of 0.377 and weighted average of 48.5%, a difference of 1.5%.
Disability Age Over 75 Correlation Summary
| Measurement | Immigrants from Uzbekistan | Sri Lankan |
| Minimum | 27.0% | 19.3% |
| Maximum | 80.4% | 100.0% |
| Range | 53.5% | 80.7% |
| Mean | 48.4% | 50.4% |
| Median | 48.2% | 48.8% |
| Interquartile 25% (IQ1) | 42.6% | 46.6% |
| Interquartile 75% (IQ3) | 52.5% | 53.7% |
| Interquartile Range (IQR) | 9.9% | 7.0% |
| Standard Deviation (Sample) | 9.8% | 11.5% |
| Standard Deviation (Population) | 9.7% | 11.4% |
Similar Demographics by Disability Age Over 75
Demographics Similar to Immigrants from Uzbekistan by Disability Age Over 75
In terms of disability age over 75, the demographic groups most similar to Immigrants from Uzbekistan are Hawaiian (49.2%, a difference of 0.020%), Immigrants from Laos (49.2%, a difference of 0.060%), Immigrants from Dominica (49.1%, a difference of 0.12%), Immigrants from Guatemala (49.1%, a difference of 0.13%), and Immigrants from Iraq (49.1%, a difference of 0.20%).
| Demographics | Rating | Rank | Disability Age Over 75 |
| Immigrants | El Salvador | 0.2 /100 | #269 | Tragic 49.0% |
| Potawatomi | 0.2 /100 | #270 | Tragic 49.0% |
| Fijians | 0.2 /100 | #271 | Tragic 49.0% |
| Assyrians/Chaldeans/Syriacs | 0.2 /100 | #272 | Tragic 49.1% |
| Immigrants | Iraq | 0.1 /100 | #273 | Tragic 49.1% |
| Immigrants | Guatemala | 0.1 /100 | #274 | Tragic 49.1% |
| Immigrants | Dominica | 0.1 /100 | #275 | Tragic 49.1% |
| Immigrants | Uzbekistan | 0.1 /100 | #276 | Tragic 49.2% |
| Hawaiians | 0.1 /100 | #277 | Tragic 49.2% |
| Immigrants | Laos | 0.1 /100 | #278 | Tragic 49.2% |
| Guamanians/Chamorros | 0.0 /100 | #279 | Tragic 49.4% |
| Bangladeshis | 0.0 /100 | #280 | Tragic 49.4% |
| Belizeans | 0.0 /100 | #281 | Tragic 49.4% |
| Blacks/African Americans | 0.0 /100 | #282 | Tragic 49.5% |
| Samoans | 0.0 /100 | #283 | Tragic 49.5% |
Demographics Similar to Sri Lankans by Disability Age Over 75
In terms of disability age over 75, the demographic groups most similar to Sri Lankans are Iroquois (48.4%, a difference of 0.060%), Chippewa (48.4%, a difference of 0.080%), American (48.4%, a difference of 0.11%), Afghan (48.4%, a difference of 0.14%), and Iraqi (48.6%, a difference of 0.21%).
| Demographics | Rating | Rank | Disability Age Over 75 |
| Native Hawaiians | 2.2 /100 | #241 | Tragic 48.3% |
| French American Indians | 2.2 /100 | #242 | Tragic 48.3% |
| Immigrants | Caribbean | 2.1 /100 | #243 | Tragic 48.4% |
| Afghans | 1.8 /100 | #244 | Tragic 48.4% |
| Americans | 1.7 /100 | #245 | Tragic 48.4% |
| Chippewa | 1.6 /100 | #246 | Tragic 48.4% |
| Iroquois | 1.6 /100 | #247 | Tragic 48.4% |
| Sri Lankans | 1.4 /100 | #248 | Tragic 48.5% |
| Iraqis | 1.0 /100 | #249 | Tragic 48.6% |
| West Indians | 0.8 /100 | #250 | Tragic 48.6% |
| Koreans | 0.8 /100 | #251 | Tragic 48.6% |
| Immigrants | South Eastern Asia | 0.7 /100 | #252 | Tragic 48.7% |
| British West Indians | 0.6 /100 | #253 | Tragic 48.7% |
| Immigrants | Vietnam | 0.6 /100 | #254 | Tragic 48.7% |
| Chinese | 0.5 /100 | #255 | Tragic 48.7% |