Yaqui vs Immigrants from Mexico Cognitive Disability
COMPARE
Yaqui
Immigrants from Mexico
Cognitive Disability
Cognitive Disability Comparison
Yaqui
Immigrants from Mexico
18.5%
COGNITIVE DISABILITY
0.0/ 100
METRIC RATING
313th/ 347
METRIC RANK
17.8%
COGNITIVE DISABILITY
1.8/ 100
METRIC RATING
237th/ 347
METRIC RANK
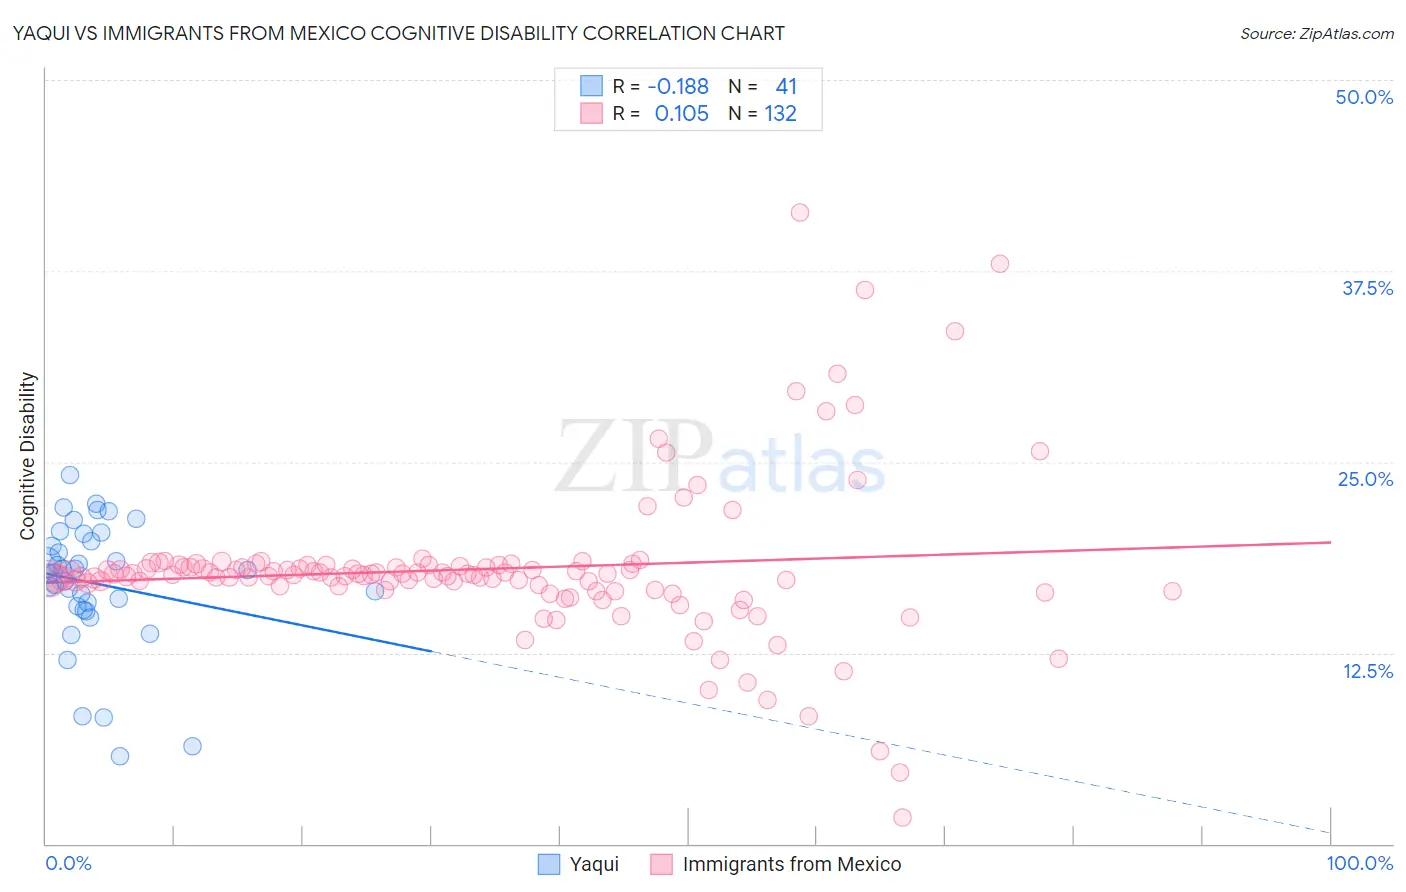
Yaqui vs Immigrants from Mexico Cognitive Disability Correlation Chart
The statistical analysis conducted on geographies consisting of 107,721,250 people shows a poor negative correlation between the proportion of Yaqui and percentage of population with cognitive disability in the United States with a correlation coefficient (R) of -0.188 and weighted average of 18.5%. Similarly, the statistical analysis conducted on geographies consisting of 513,604,710 people shows a poor positive correlation between the proportion of Immigrants from Mexico and percentage of population with cognitive disability in the United States with a correlation coefficient (R) of 0.105 and weighted average of 17.8%, a difference of 4.2%.
Cognitive Disability Correlation Summary
| Measurement | Yaqui | Immigrants from Mexico |
| Minimum | 5.8% | 1.8% |
| Maximum | 24.2% | 41.3% |
| Range | 18.4% | 39.6% |
| Mean | 17.0% | 18.0% |
| Median | 17.8% | 17.6% |
| Interquartile 25% (IQ1) | 15.4% | 16.7% |
| Interquartile 75% (IQ3) | 20.1% | 18.2% |
| Interquartile Range (IQR) | 4.7% | 1.4% |
| Standard Deviation (Sample) | 4.2% | 5.2% |
| Standard Deviation (Population) | 4.1% | 5.2% |
Similar Demographics by Cognitive Disability
Demographics Similar to Yaqui by Cognitive Disability
In terms of cognitive disability, the demographic groups most similar to Yaqui are Subsaharan African (18.5%, a difference of 0.060%), Chickasaw (18.5%, a difference of 0.11%), Immigrants from Dominica (18.6%, a difference of 0.24%), Immigrants from Middle Africa (18.6%, a difference of 0.32%), and Hmong (18.4%, a difference of 0.39%).
| Demographics | Rating | Rank | Cognitive Disability |
| Seminole | 0.0 /100 | #306 | Tragic 18.3% |
| Ugandans | 0.0 /100 | #307 | Tragic 18.3% |
| Immigrants | Western Africa | 0.0 /100 | #308 | Tragic 18.4% |
| Immigrants | Eastern Africa | 0.0 /100 | #309 | Tragic 18.4% |
| Choctaw | 0.0 /100 | #310 | Tragic 18.4% |
| Hmong | 0.0 /100 | #311 | Tragic 18.4% |
| Chickasaw | 0.0 /100 | #312 | Tragic 18.5% |
| Yaqui | 0.0 /100 | #313 | Tragic 18.5% |
| Sub-Saharan Africans | 0.0 /100 | #314 | Tragic 18.5% |
| Immigrants | Dominica | 0.0 /100 | #315 | Tragic 18.6% |
| Immigrants | Middle Africa | 0.0 /100 | #316 | Tragic 18.6% |
| Liberians | 0.0 /100 | #317 | Tragic 18.6% |
| Bangladeshis | 0.0 /100 | #318 | Tragic 18.6% |
| Comanche | 0.0 /100 | #319 | Tragic 18.6% |
| Apache | 0.0 /100 | #320 | Tragic 18.6% |
Demographics Similar to Immigrants from Mexico by Cognitive Disability
In terms of cognitive disability, the demographic groups most similar to Immigrants from Mexico are Immigrants from Iraq (17.8%, a difference of 0.010%), Cheyenne (17.8%, a difference of 0.040%), Osage (17.8%, a difference of 0.070%), Spanish American Indian (17.8%, a difference of 0.070%), and Guatemalan (17.8%, a difference of 0.090%).
| Demographics | Rating | Rank | Cognitive Disability |
| Mongolians | 2.2 /100 | #230 | Tragic 17.7% |
| Guatemalans | 2.1 /100 | #231 | Tragic 17.8% |
| Tongans | 2.1 /100 | #232 | Tragic 17.8% |
| Panamanians | 2.1 /100 | #233 | Tragic 17.8% |
| Osage | 2.0 /100 | #234 | Tragic 17.8% |
| Spanish American Indians | 2.0 /100 | #235 | Tragic 17.8% |
| Immigrants | Iraq | 1.8 /100 | #236 | Tragic 17.8% |
| Immigrants | Mexico | 1.8 /100 | #237 | Tragic 17.8% |
| Cheyenne | 1.7 /100 | #238 | Tragic 17.8% |
| Cajuns | 1.4 /100 | #239 | Tragic 17.8% |
| Iraqis | 1.4 /100 | #240 | Tragic 17.8% |
| Mexicans | 1.1 /100 | #241 | Tragic 17.8% |
| Paiute | 1.1 /100 | #242 | Tragic 17.8% |
| Immigrants | Bangladesh | 1.0 /100 | #243 | Tragic 17.8% |
| Jamaicans | 0.9 /100 | #244 | Tragic 17.9% |