Romanian vs Bulgarian Disability Age Over 75
COMPARE
Romanian
Bulgarian
Disability Age Over 75
Disability Age Over 75 Comparison
Romanians
Bulgarians
46.2%
DISABILITY AGE OVER 75
98.6/ 100
METRIC RATING
86th/ 347
METRIC RANK
45.1%
DISABILITY AGE OVER 75
100.0/ 100
METRIC RATING
10th/ 347
METRIC RANK
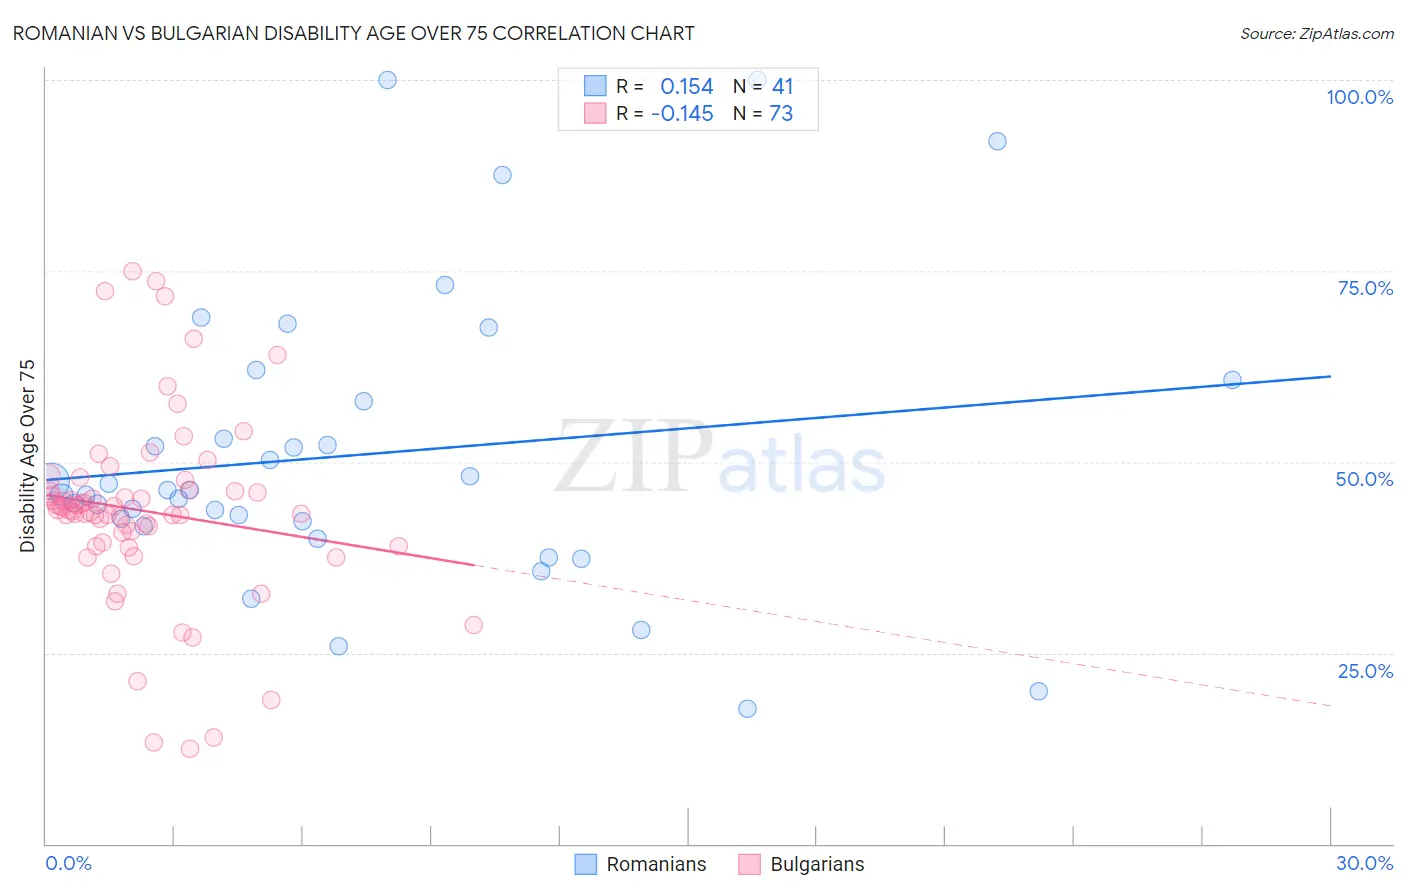
Romanian vs Bulgarian Disability Age Over 75 Correlation Chart
The statistical analysis conducted on geographies consisting of 377,383,328 people shows a poor positive correlation between the proportion of Romanians and percentage of population with a disability over the age of 75 in the United States with a correlation coefficient (R) of 0.154 and weighted average of 46.2%. Similarly, the statistical analysis conducted on geographies consisting of 205,489,445 people shows a poor negative correlation between the proportion of Bulgarians and percentage of population with a disability over the age of 75 in the United States with a correlation coefficient (R) of -0.145 and weighted average of 45.1%, a difference of 2.6%.
Disability Age Over 75 Correlation Summary
| Measurement | Romanian | Bulgarian |
| Minimum | 17.6% | 12.4% |
| Maximum | 100.0% | 75.0% |
| Range | 82.4% | 62.6% |
| Mean | 51.0% | 43.6% |
| Median | 46.3% | 43.7% |
| Interquartile 25% (IQ1) | 41.8% | 39.2% |
| Interquartile 75% (IQ3) | 59.3% | 46.3% |
| Interquartile Range (IQR) | 17.5% | 7.1% |
| Standard Deviation (Sample) | 19.0% | 12.2% |
| Standard Deviation (Population) | 18.8% | 12.1% |
Similar Demographics by Disability Age Over 75
Demographics Similar to Romanians by Disability Age Over 75
In terms of disability age over 75, the demographic groups most similar to Romanians are Immigrants from Southern Europe (46.2%, a difference of 0.0%), Danish (46.2%, a difference of 0.0%), Immigrants from Jordan (46.2%, a difference of 0.020%), Immigrants from Latvia (46.2%, a difference of 0.030%), and Argentinean (46.2%, a difference of 0.030%).
| Demographics | Rating | Rank | Disability Age Over 75 |
| Swiss | 98.8 /100 | #79 | Exceptional 46.2% |
| Soviet Union | 98.8 /100 | #80 | Exceptional 46.2% |
| New Zealanders | 98.8 /100 | #81 | Exceptional 46.2% |
| Immigrants | Latvia | 98.7 /100 | #82 | Exceptional 46.2% |
| Argentineans | 98.7 /100 | #83 | Exceptional 46.2% |
| Immigrants | Jordan | 98.7 /100 | #84 | Exceptional 46.2% |
| Immigrants | Southern Europe | 98.6 /100 | #85 | Exceptional 46.2% |
| Romanians | 98.6 /100 | #86 | Exceptional 46.2% |
| Danes | 98.6 /100 | #87 | Exceptional 46.2% |
| Uruguayans | 98.4 /100 | #88 | Exceptional 46.2% |
| Immigrants | Saudi Arabia | 98.4 /100 | #89 | Exceptional 46.3% |
| Northern Europeans | 98.3 /100 | #90 | Exceptional 46.3% |
| Immigrants | Egypt | 98.3 /100 | #91 | Exceptional 46.3% |
| Germans | 98.2 /100 | #92 | Exceptional 46.3% |
| Ugandans | 98.2 /100 | #93 | Exceptional 46.3% |
Demographics Similar to Bulgarians by Disability Age Over 75
In terms of disability age over 75, the demographic groups most similar to Bulgarians are Lithuanian (45.1%, a difference of 0.050%), Immigrants from Czechoslovakia (45.1%, a difference of 0.14%), Latvian (45.1%, a difference of 0.15%), Paraguayan (45.0%, a difference of 0.16%), and Immigrants from Scotland (45.1%, a difference of 0.16%).
| Demographics | Rating | Rank | Disability Age Over 75 |
| Eastern Europeans | 100.0 /100 | #3 | Exceptional 44.8% |
| Carpatho Rusyns | 100.0 /100 | #4 | Exceptional 44.8% |
| Luxembourgers | 100.0 /100 | #5 | Exceptional 44.8% |
| Immigrants | Lithuania | 100.0 /100 | #6 | Exceptional 44.9% |
| Okinawans | 100.0 /100 | #7 | Exceptional 44.9% |
| Immigrants | Austria | 100.0 /100 | #8 | Exceptional 44.9% |
| Paraguayans | 100.0 /100 | #9 | Exceptional 45.0% |
| Bulgarians | 100.0 /100 | #10 | Exceptional 45.1% |
| Lithuanians | 100.0 /100 | #11 | Exceptional 45.1% |
| Immigrants | Czechoslovakia | 100.0 /100 | #12 | Exceptional 45.1% |
| Latvians | 100.0 /100 | #13 | Exceptional 45.1% |
| Immigrants | Scotland | 100.0 /100 | #14 | Exceptional 45.1% |
| Immigrants | Sweden | 100.0 /100 | #15 | Exceptional 45.1% |
| Immigrants | Northern Europe | 100.0 /100 | #16 | Exceptional 45.2% |
| Immigrants | India | 100.0 /100 | #17 | Exceptional 45.2% |