Pueblo vs Slovene Ambulatory Disability
COMPARE
Pueblo
Slovene
Ambulatory Disability
Ambulatory Disability Comparison
Pueblo
Slovenes
7.6%
AMBULATORY DISABILITY
0.0/ 100
METRIC RATING
329th/ 347
METRIC RANK
6.2%
AMBULATORY DISABILITY
18.0/ 100
METRIC RATING
205th/ 347
METRIC RANK
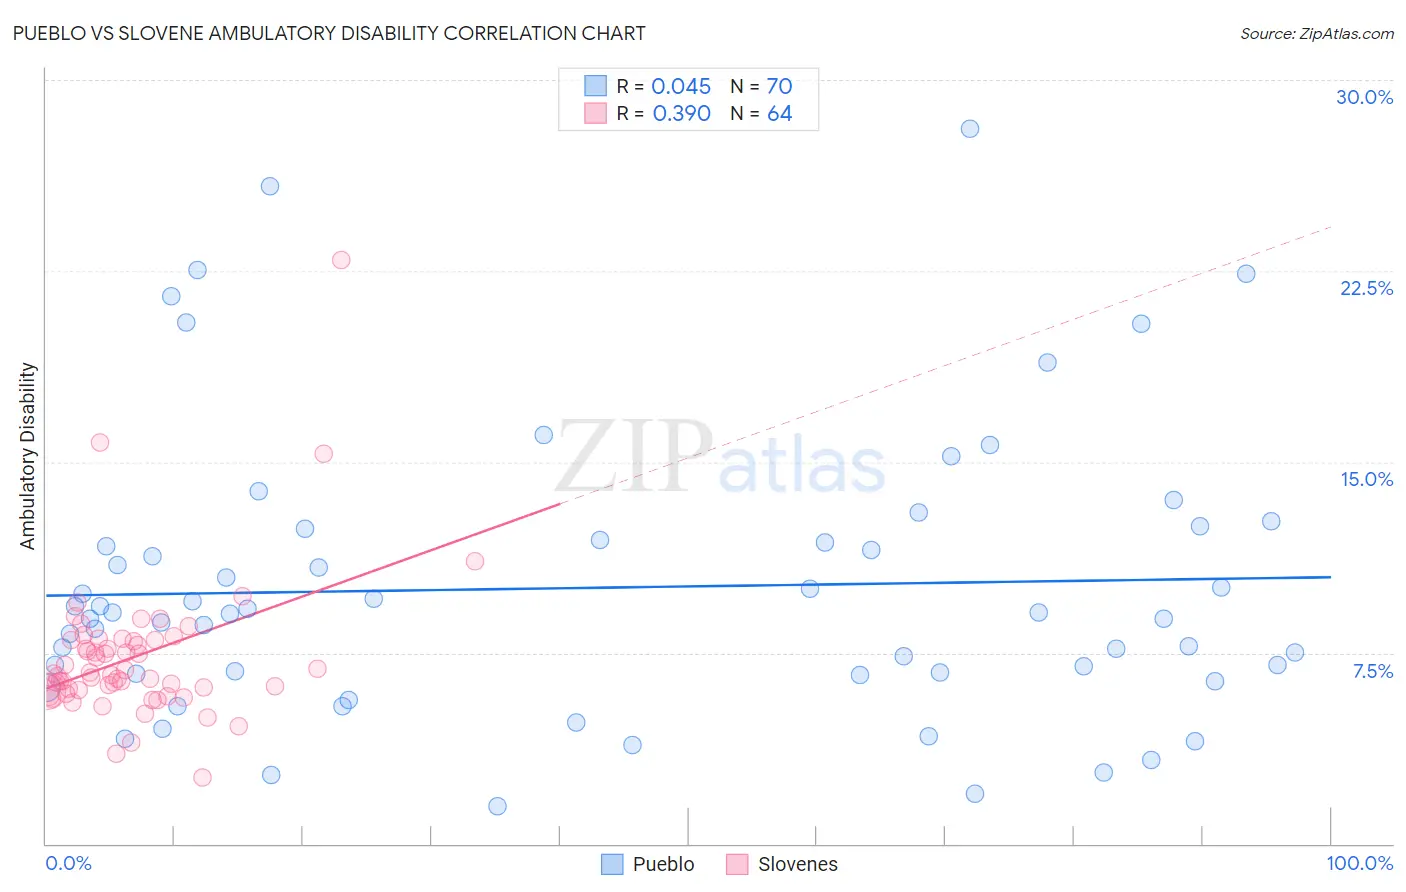
Pueblo vs Slovene Ambulatory Disability Correlation Chart
The statistical analysis conducted on geographies consisting of 120,067,140 people shows no correlation between the proportion of Pueblo and percentage of population with ambulatory disability in the United States with a correlation coefficient (R) of 0.045 and weighted average of 7.6%. Similarly, the statistical analysis conducted on geographies consisting of 261,334,117 people shows a mild positive correlation between the proportion of Slovenes and percentage of population with ambulatory disability in the United States with a correlation coefficient (R) of 0.390 and weighted average of 6.2%, a difference of 21.7%.
Ambulatory Disability Correlation Summary
| Measurement | Pueblo | Slovene |
| Minimum | 1.5% | 2.6% |
| Maximum | 28.1% | 23.0% |
| Range | 26.6% | 20.4% |
| Mean | 10.1% | 7.3% |
| Median | 9.1% | 6.7% |
| Interquartile 25% (IQ1) | 6.7% | 6.0% |
| Interquartile 75% (IQ3) | 11.9% | 8.0% |
| Interquartile Range (IQR) | 5.2% | 2.0% |
| Standard Deviation (Sample) | 5.6% | 2.9% |
| Standard Deviation (Population) | 5.6% | 2.9% |
Similar Demographics by Ambulatory Disability
Demographics Similar to Pueblo by Ambulatory Disability
In terms of ambulatory disability, the demographic groups most similar to Pueblo are Hopi (7.6%, a difference of 0.040%), Native/Alaskan (7.5%, a difference of 0.98%), Black/African American (7.5%, a difference of 0.99%), Comanche (7.5%, a difference of 1.1%), and Navajo (7.5%, a difference of 1.2%).
| Demographics | Rating | Rank | Ambulatory Disability |
| Osage | 0.0 /100 | #322 | Tragic 7.4% |
| Americans | 0.0 /100 | #323 | Tragic 7.4% |
| Navajo | 0.0 /100 | #324 | Tragic 7.5% |
| Comanche | 0.0 /100 | #325 | Tragic 7.5% |
| Blacks/African Americans | 0.0 /100 | #326 | Tragic 7.5% |
| Natives/Alaskans | 0.0 /100 | #327 | Tragic 7.5% |
| Hopi | 0.0 /100 | #328 | Tragic 7.6% |
| Pueblo | 0.0 /100 | #329 | Tragic 7.6% |
| Paiute | 0.0 /100 | #330 | Tragic 7.7% |
| Cajuns | 0.0 /100 | #331 | Tragic 7.8% |
| Menominee | 0.0 /100 | #332 | Tragic 7.8% |
| Cherokee | 0.0 /100 | #333 | Tragic 7.9% |
| Yuman | 0.0 /100 | #334 | Tragic 7.9% |
| Chickasaw | 0.0 /100 | #335 | Tragic 8.0% |
| Seminole | 0.0 /100 | #336 | Tragic 8.0% |
Demographics Similar to Slovenes by Ambulatory Disability
In terms of ambulatory disability, the demographic groups most similar to Slovenes are Immigrants from Congo (6.2%, a difference of 0.020%), Immigrants from Ukraine (6.2%, a difference of 0.030%), Finnish (6.2%, a difference of 0.070%), Albanian (6.2%, a difference of 0.15%), and Immigrants from Central America (6.2%, a difference of 0.17%).
| Demographics | Rating | Rank | Ambulatory Disability |
| Immigrants | Bangladesh | 24.6 /100 | #198 | Fair 6.2% |
| Italians | 22.6 /100 | #199 | Fair 6.2% |
| Immigrants | Cambodia | 21.5 /100 | #200 | Fair 6.2% |
| Immigrants | Central America | 20.1 /100 | #201 | Fair 6.2% |
| Albanians | 19.7 /100 | #202 | Poor 6.2% |
| Immigrants | Ukraine | 18.4 /100 | #203 | Poor 6.2% |
| Immigrants | Congo | 18.2 /100 | #204 | Poor 6.2% |
| Slovenes | 18.0 /100 | #205 | Poor 6.2% |
| Finns | 17.2 /100 | #206 | Poor 6.2% |
| Alsatians | 15.1 /100 | #207 | Poor 6.3% |
| Bangladeshis | 14.2 /100 | #208 | Poor 6.3% |
| Immigrants | Iraq | 14.0 /100 | #209 | Poor 6.3% |
| Immigrants | Laos | 13.2 /100 | #210 | Poor 6.3% |
| Samoans | 12.1 /100 | #211 | Poor 6.3% |
| Mexican American Indians | 12.0 /100 | #212 | Poor 6.3% |