Paraguayan vs Immigrants from Caribbean Self-Care Disability
COMPARE
Paraguayan
Immigrants from Caribbean
Self-Care Disability
Self-Care Disability Comparison
Paraguayans
Immigrants from Caribbean
2.3%
SELF-CARE DISABILITY
99.9/ 100
METRIC RATING
30th/ 347
METRIC RANK
2.8%
SELF-CARE DISABILITY
0.0/ 100
METRIC RATING
312th/ 347
METRIC RANK
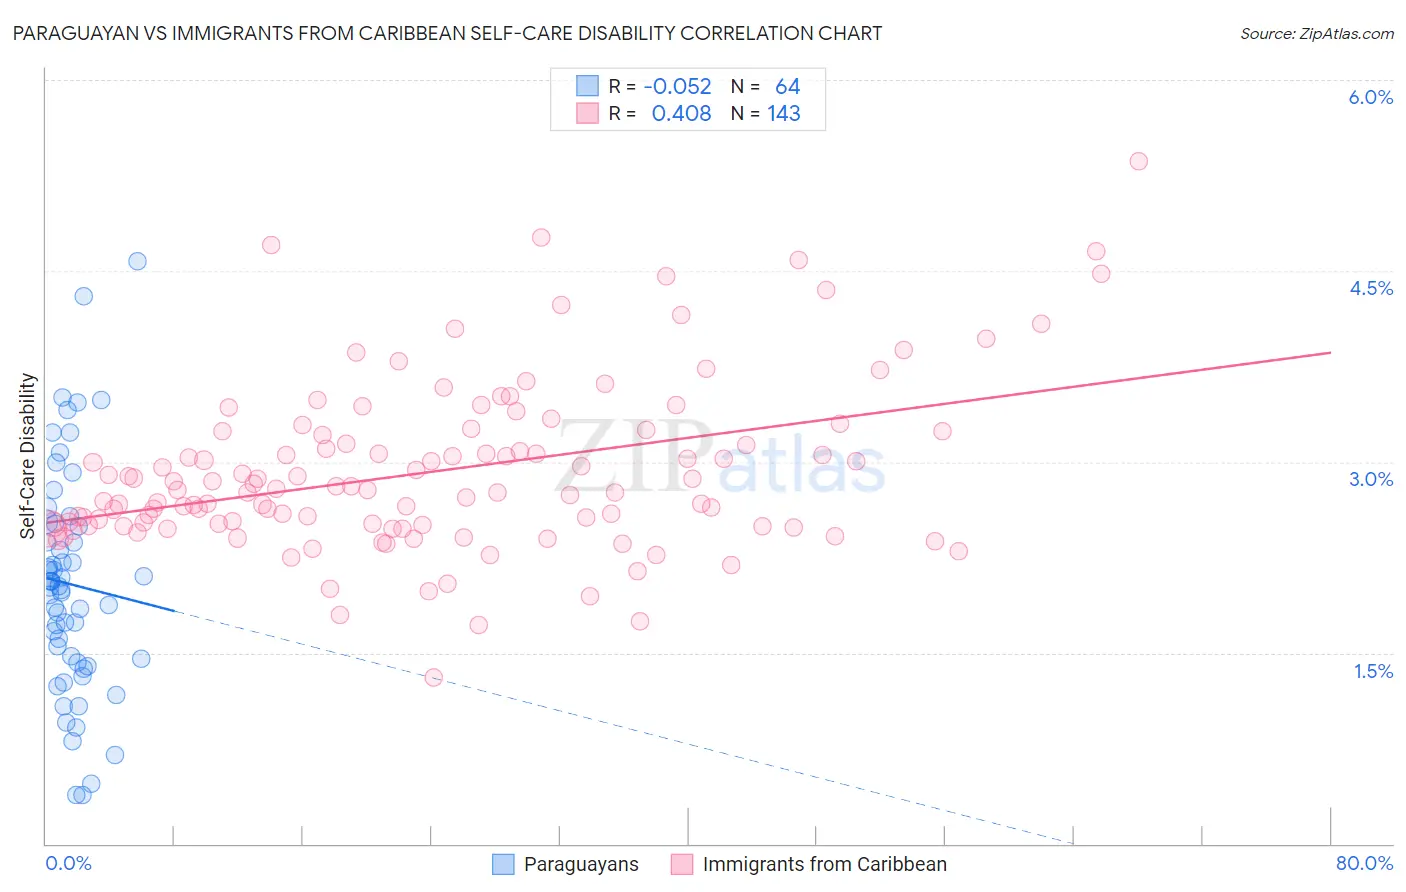
Paraguayan vs Immigrants from Caribbean Self-Care Disability Correlation Chart
The statistical analysis conducted on geographies consisting of 95,092,282 people shows a slight negative correlation between the proportion of Paraguayans and percentage of population with self-care disability in the United States with a correlation coefficient (R) of -0.052 and weighted average of 2.3%. Similarly, the statistical analysis conducted on geographies consisting of 449,223,668 people shows a moderate positive correlation between the proportion of Immigrants from Caribbean and percentage of population with self-care disability in the United States with a correlation coefficient (R) of 0.408 and weighted average of 2.8%, a difference of 25.3%.
Self-Care Disability Correlation Summary
| Measurement | Paraguayan | Immigrants from Caribbean |
| Minimum | 0.38% | 1.3% |
| Maximum | 4.6% | 5.4% |
| Range | 4.2% | 4.1% |
| Mean | 2.0% | 2.9% |
| Median | 2.0% | 2.8% |
| Interquartile 25% (IQ1) | 1.4% | 2.5% |
| Interquartile 75% (IQ3) | 2.5% | 3.2% |
| Interquartile Range (IQR) | 1.1% | 0.74% |
| Standard Deviation (Sample) | 0.88% | 0.67% |
| Standard Deviation (Population) | 0.87% | 0.66% |
Similar Demographics by Self-Care Disability
Demographics Similar to Paraguayans by Self-Care Disability
In terms of self-care disability, the demographic groups most similar to Paraguayans are Danish (2.3%, a difference of 0.010%), Burmese (2.3%, a difference of 0.080%), Immigrants from Korea (2.3%, a difference of 0.31%), Immigrants from Zimbabwe (2.3%, a difference of 0.33%), and Immigrants from Turkey (2.3%, a difference of 0.37%).
| Demographics | Rating | Rank | Self-Care Disability |
| Cambodians | 100.0 /100 | #23 | Exceptional 2.2% |
| Cypriots | 100.0 /100 | #24 | Exceptional 2.2% |
| Turks | 100.0 /100 | #25 | Exceptional 2.2% |
| Immigrants | Sri Lanka | 99.9 /100 | #26 | Exceptional 2.2% |
| Venezuelans | 99.9 /100 | #27 | Exceptional 2.2% |
| Inupiat | 99.9 /100 | #28 | Exceptional 2.2% |
| Immigrants | Zimbabwe | 99.9 /100 | #29 | Exceptional 2.3% |
| Paraguayans | 99.9 /100 | #30 | Exceptional 2.3% |
| Danes | 99.9 /100 | #31 | Exceptional 2.3% |
| Burmese | 99.9 /100 | #32 | Exceptional 2.3% |
| Immigrants | Korea | 99.9 /100 | #33 | Exceptional 2.3% |
| Immigrants | Turkey | 99.9 /100 | #34 | Exceptional 2.3% |
| Immigrants | Australia | 99.9 /100 | #35 | Exceptional 2.3% |
| Immigrants | Lithuania | 99.9 /100 | #36 | Exceptional 2.3% |
| Immigrants | Sweden | 99.9 /100 | #37 | Exceptional 2.3% |
Demographics Similar to Immigrants from Caribbean by Self-Care Disability
In terms of self-care disability, the demographic groups most similar to Immigrants from Caribbean are Spanish American (2.8%, a difference of 0.030%), Puget Sound Salish (2.8%, a difference of 0.19%), Creek (2.8%, a difference of 0.25%), British West Indian (2.8%, a difference of 0.26%), and Bangladeshi (2.8%, a difference of 0.36%).
| Demographics | Rating | Rank | Self-Care Disability |
| Immigrants | West Indies | 0.0 /100 | #305 | Tragic 2.8% |
| Aleuts | 0.0 /100 | #306 | Tragic 2.8% |
| Natives/Alaskans | 0.0 /100 | #307 | Tragic 2.8% |
| Immigrants | Grenada | 0.0 /100 | #308 | Tragic 2.8% |
| Bangladeshis | 0.0 /100 | #309 | Tragic 2.8% |
| British West Indians | 0.0 /100 | #310 | Tragic 2.8% |
| Puget Sound Salish | 0.0 /100 | #311 | Tragic 2.8% |
| Immigrants | Caribbean | 0.0 /100 | #312 | Tragic 2.8% |
| Spanish Americans | 0.0 /100 | #313 | Tragic 2.8% |
| Creek | 0.0 /100 | #314 | Tragic 2.8% |
| Immigrants | Cuba | 0.0 /100 | #315 | Tragic 2.8% |
| Menominee | 0.0 /100 | #316 | Tragic 2.8% |
| Immigrants | Dominica | 0.0 /100 | #317 | Tragic 2.8% |
| Assyrians/Chaldeans/Syriacs | 0.0 /100 | #318 | Tragic 2.8% |
| Spanish American Indians | 0.0 /100 | #319 | Tragic 2.9% |