Immigrants from Romania vs Cherokee Vision Disability
COMPARE
Immigrants from Romania
Cherokee
Vision Disability
Vision Disability Comparison
Immigrants from Romania
Cherokee
2.0%
VISION DISABILITY
99.1/ 100
METRIC RATING
60th/ 347
METRIC RANK
2.9%
VISION DISABILITY
0.0/ 100
METRIC RATING
325th/ 347
METRIC RANK
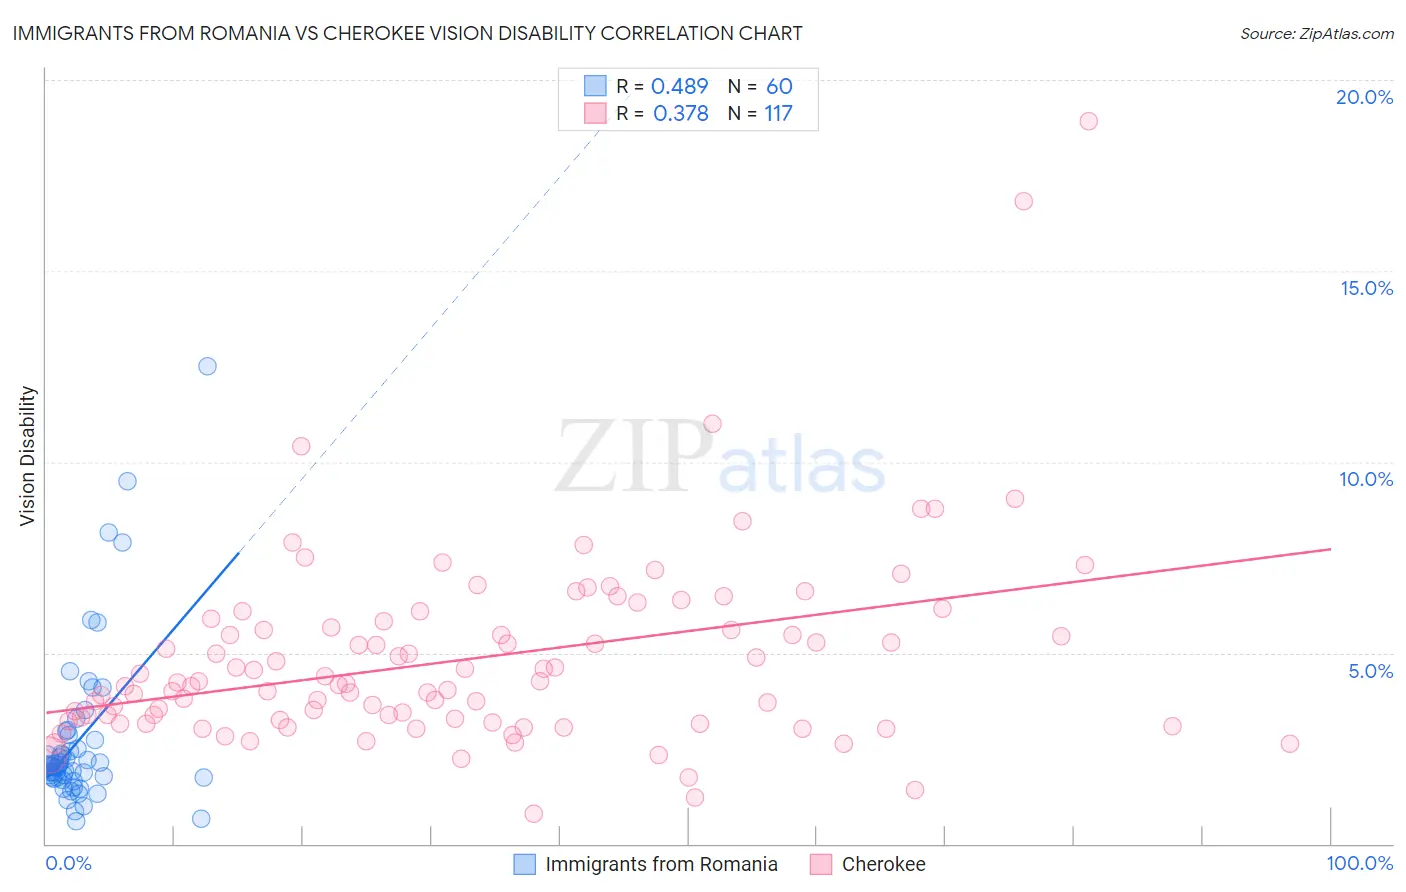
Immigrants from Romania vs Cherokee Vision Disability Correlation Chart
The statistical analysis conducted on geographies consisting of 256,950,873 people shows a moderate positive correlation between the proportion of Immigrants from Romania and percentage of population with vision disability in the United States with a correlation coefficient (R) of 0.489 and weighted average of 2.0%. Similarly, the statistical analysis conducted on geographies consisting of 493,069,891 people shows a mild positive correlation between the proportion of Cherokee and percentage of population with vision disability in the United States with a correlation coefficient (R) of 0.378 and weighted average of 2.9%, a difference of 45.2%.
Vision Disability Correlation Summary
| Measurement | Immigrants from Romania | Cherokee |
| Minimum | 0.58% | 0.78% |
| Maximum | 12.5% | 18.9% |
| Range | 11.9% | 18.1% |
| Mean | 2.7% | 4.8% |
| Median | 2.0% | 4.2% |
| Interquartile 25% (IQ1) | 1.7% | 3.2% |
| Interquartile 75% (IQ3) | 2.8% | 5.8% |
| Interquartile Range (IQR) | 1.0% | 2.5% |
| Standard Deviation (Sample) | 2.2% | 2.5% |
| Standard Deviation (Population) | 2.1% | 2.5% |
Similar Demographics by Vision Disability
Demographics Similar to Immigrants from Romania by Vision Disability
In terms of vision disability, the demographic groups most similar to Immigrants from Romania are Immigrants from Belgium (2.0%, a difference of 0.010%), Argentinean (2.0%, a difference of 0.030%), Immigrants from Russia (2.0%, a difference of 0.030%), Armenian (2.0%, a difference of 0.15%), and Immigrants from Saudi Arabia (2.0%, a difference of 0.17%).
| Demographics | Rating | Rank | Vision Disability |
| Immigrants | Belarus | 99.3 /100 | #53 | Exceptional 2.0% |
| Macedonians | 99.3 /100 | #54 | Exceptional 2.0% |
| Laotians | 99.3 /100 | #55 | Exceptional 2.0% |
| Jordanians | 99.2 /100 | #56 | Exceptional 2.0% |
| Somalis | 99.2 /100 | #57 | Exceptional 2.0% |
| Immigrants | Saudi Arabia | 99.2 /100 | #58 | Exceptional 2.0% |
| Argentineans | 99.1 /100 | #59 | Exceptional 2.0% |
| Immigrants | Romania | 99.1 /100 | #60 | Exceptional 2.0% |
| Immigrants | Belgium | 99.1 /100 | #61 | Exceptional 2.0% |
| Immigrants | Russia | 99.1 /100 | #62 | Exceptional 2.0% |
| Armenians | 99.0 /100 | #63 | Exceptional 2.0% |
| Immigrants | Greece | 99.0 /100 | #64 | Exceptional 2.0% |
| Maltese | 98.9 /100 | #65 | Exceptional 2.0% |
| Immigrants | Argentina | 98.9 /100 | #66 | Exceptional 2.0% |
| Immigrants | Northern Africa | 98.8 /100 | #67 | Exceptional 2.0% |
Demographics Similar to Cherokee by Vision Disability
In terms of vision disability, the demographic groups most similar to Cherokee are Hopi (2.9%, a difference of 0.010%), Spanish American (2.9%, a difference of 1.2%), Native/Alaskan (3.0%, a difference of 2.0%), Tlingit-Haida (2.9%, a difference of 2.0%), and Paiute (2.9%, a difference of 2.0%).
| Demographics | Rating | Rank | Vision Disability |
| Alaska Natives | 0.0 /100 | #318 | Tragic 2.7% |
| Tohono O'odham | 0.0 /100 | #319 | Tragic 2.8% |
| Blacks/African Americans | 0.0 /100 | #320 | Tragic 2.8% |
| Comanche | 0.0 /100 | #321 | Tragic 2.8% |
| Paiute | 0.0 /100 | #322 | Tragic 2.9% |
| Tlingit-Haida | 0.0 /100 | #323 | Tragic 2.9% |
| Hopi | 0.0 /100 | #324 | Tragic 2.9% |
| Cherokee | 0.0 /100 | #325 | Tragic 2.9% |
| Spanish Americans | 0.0 /100 | #326 | Tragic 2.9% |
| Natives/Alaskans | 0.0 /100 | #327 | Tragic 3.0% |
| Yuman | 0.0 /100 | #328 | Tragic 3.0% |
| Apache | 0.0 /100 | #329 | Tragic 3.0% |
| Colville | 0.0 /100 | #330 | Tragic 3.0% |
| Central American Indians | 0.0 /100 | #331 | Tragic 3.0% |
| Seminole | 0.0 /100 | #332 | Tragic 3.1% |