Slovene vs Cherokee Vision Disability
COMPARE
Slovene
Cherokee
Vision Disability
Vision Disability Comparison
Slovenes
Cherokee
2.1%
VISION DISABILITY
73.6/ 100
METRIC RATING
154th/ 347
METRIC RANK
2.9%
VISION DISABILITY
0.0/ 100
METRIC RATING
325th/ 347
METRIC RANK
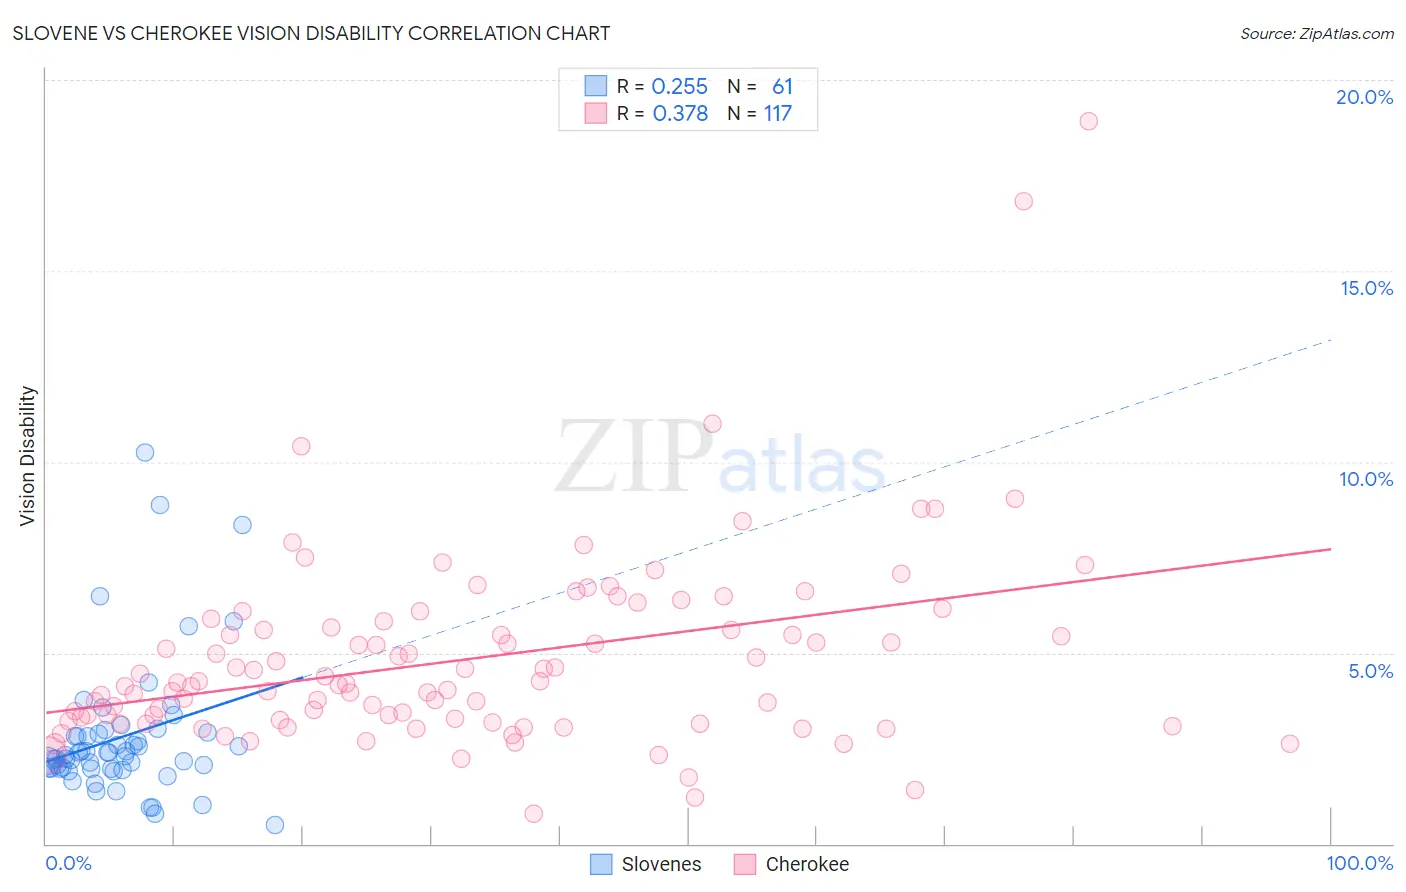
Slovene vs Cherokee Vision Disability Correlation Chart
The statistical analysis conducted on geographies consisting of 261,215,676 people shows a weak positive correlation between the proportion of Slovenes and percentage of population with vision disability in the United States with a correlation coefficient (R) of 0.255 and weighted average of 2.1%. Similarly, the statistical analysis conducted on geographies consisting of 493,069,891 people shows a mild positive correlation between the proportion of Cherokee and percentage of population with vision disability in the United States with a correlation coefficient (R) of 0.378 and weighted average of 2.9%, a difference of 36.6%.
Vision Disability Correlation Summary
| Measurement | Slovene | Cherokee |
| Minimum | 0.49% | 0.78% |
| Maximum | 10.3% | 18.9% |
| Range | 9.8% | 18.1% |
| Mean | 2.8% | 4.8% |
| Median | 2.3% | 4.2% |
| Interquartile 25% (IQ1) | 2.0% | 3.2% |
| Interquartile 75% (IQ3) | 2.9% | 5.8% |
| Interquartile Range (IQR) | 0.94% | 2.5% |
| Standard Deviation (Sample) | 1.8% | 2.5% |
| Standard Deviation (Population) | 1.8% | 2.5% |
Similar Demographics by Vision Disability
Demographics Similar to Slovenes by Vision Disability
In terms of vision disability, the demographic groups most similar to Slovenes are Immigrants from South America (2.1%, a difference of 0.010%), Immigrants from Southern Europe (2.1%, a difference of 0.080%), Immigrants from Colombia (2.1%, a difference of 0.12%), Immigrants from Norway (2.1%, a difference of 0.16%), and Pakistani (2.1%, a difference of 0.16%).
| Demographics | Rating | Rank | Vision Disability |
| Immigrants | Sudan | 78.4 /100 | #147 | Good 2.1% |
| Finns | 78.3 /100 | #148 | Good 2.1% |
| Colombians | 76.2 /100 | #149 | Good 2.1% |
| Belgians | 75.9 /100 | #150 | Good 2.1% |
| Immigrants | Norway | 75.5 /100 | #151 | Good 2.1% |
| Immigrants | Southern Europe | 74.6 /100 | #152 | Good 2.1% |
| Immigrants | South America | 73.8 /100 | #153 | Good 2.1% |
| Slovenes | 73.6 /100 | #154 | Good 2.1% |
| Immigrants | Colombia | 72.1 /100 | #155 | Good 2.1% |
| Pakistanis | 71.6 /100 | #156 | Good 2.1% |
| Serbians | 70.2 /100 | #157 | Good 2.1% |
| Immigrants | Uzbekistan | 69.9 /100 | #158 | Good 2.1% |
| South Africans | 69.8 /100 | #159 | Good 2.1% |
| Austrians | 69.0 /100 | #160 | Good 2.1% |
| Iraqis | 67.7 /100 | #161 | Good 2.1% |
Demographics Similar to Cherokee by Vision Disability
In terms of vision disability, the demographic groups most similar to Cherokee are Hopi (2.9%, a difference of 0.010%), Spanish American (2.9%, a difference of 1.2%), Native/Alaskan (3.0%, a difference of 2.0%), Tlingit-Haida (2.9%, a difference of 2.0%), and Paiute (2.9%, a difference of 2.0%).
| Demographics | Rating | Rank | Vision Disability |
| Alaska Natives | 0.0 /100 | #318 | Tragic 2.7% |
| Tohono O'odham | 0.0 /100 | #319 | Tragic 2.8% |
| Blacks/African Americans | 0.0 /100 | #320 | Tragic 2.8% |
| Comanche | 0.0 /100 | #321 | Tragic 2.8% |
| Paiute | 0.0 /100 | #322 | Tragic 2.9% |
| Tlingit-Haida | 0.0 /100 | #323 | Tragic 2.9% |
| Hopi | 0.0 /100 | #324 | Tragic 2.9% |
| Cherokee | 0.0 /100 | #325 | Tragic 2.9% |
| Spanish Americans | 0.0 /100 | #326 | Tragic 2.9% |
| Natives/Alaskans | 0.0 /100 | #327 | Tragic 3.0% |
| Yuman | 0.0 /100 | #328 | Tragic 3.0% |
| Apache | 0.0 /100 | #329 | Tragic 3.0% |
| Colville | 0.0 /100 | #330 | Tragic 3.0% |
| Central American Indians | 0.0 /100 | #331 | Tragic 3.0% |
| Seminole | 0.0 /100 | #332 | Tragic 3.1% |