Immigrants from Zaire vs Immigrants from Kenya Disability Age Over 75
COMPARE
Immigrants from Zaire
Immigrants from Kenya
Disability Age Over 75
Disability Age Over 75 Comparison
Immigrants from Zaire
Immigrants from Kenya
47.1%
DISABILITY AGE OVER 75
74.8/ 100
METRIC RATING
153rd/ 347
METRIC RANK
47.6%
DISABILITY AGE OVER 75
30.8/ 100
METRIC RATING
189th/ 347
METRIC RANK
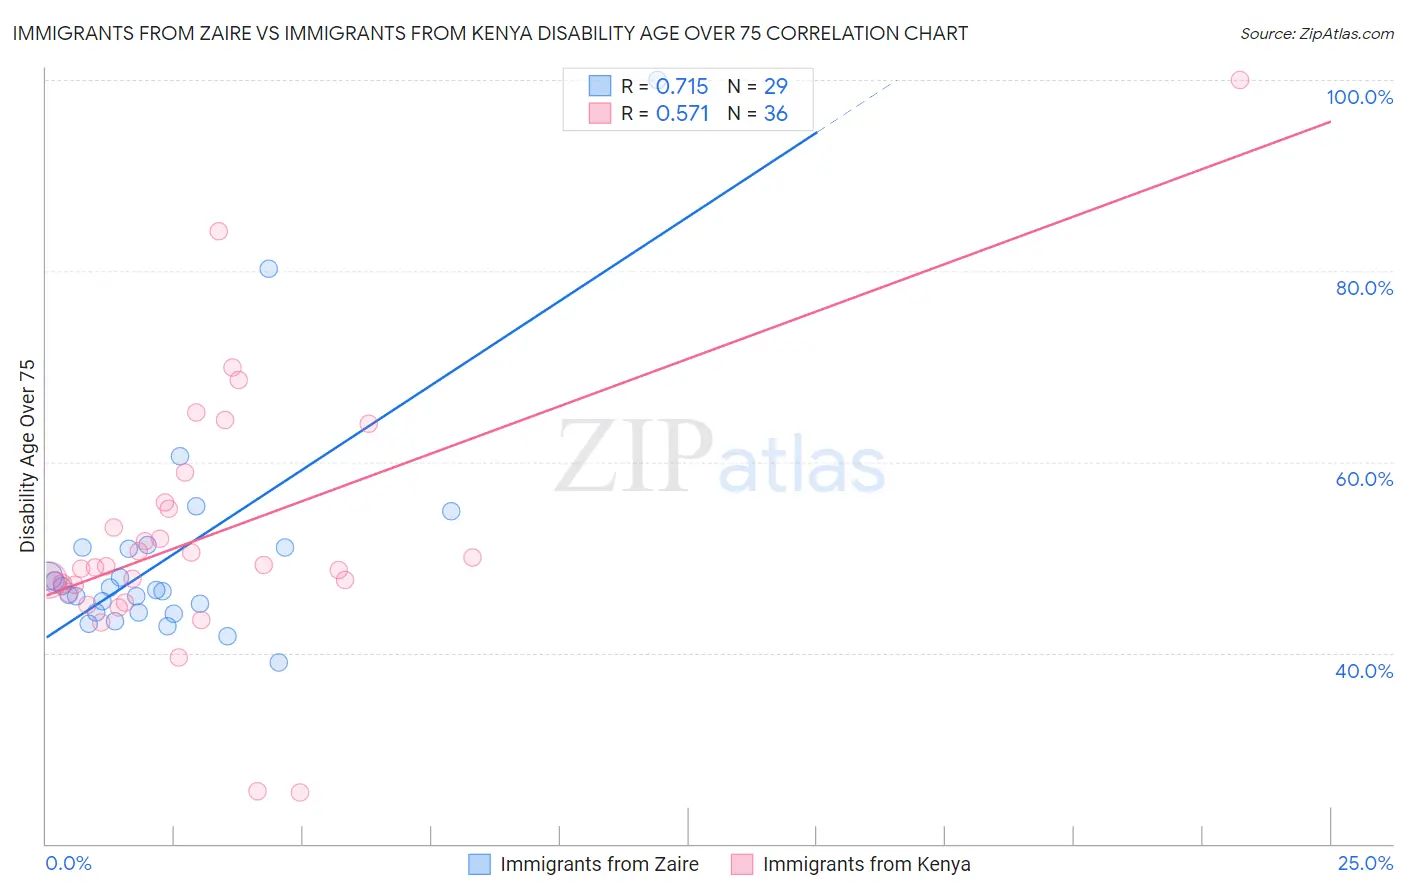
Immigrants from Zaire vs Immigrants from Kenya Disability Age Over 75 Correlation Chart
The statistical analysis conducted on geographies consisting of 107,207,758 people shows a strong positive correlation between the proportion of Immigrants from Zaire and percentage of population with a disability over the age of 75 in the United States with a correlation coefficient (R) of 0.715 and weighted average of 47.1%. Similarly, the statistical analysis conducted on geographies consisting of 217,778,670 people shows a substantial positive correlation between the proportion of Immigrants from Kenya and percentage of population with a disability over the age of 75 in the United States with a correlation coefficient (R) of 0.571 and weighted average of 47.6%, a difference of 1.1%.
Disability Age Over 75 Correlation Summary
| Measurement | Immigrants from Zaire | Immigrants from Kenya |
| Minimum | 39.0% | 25.4% |
| Maximum | 100.0% | 100.0% |
| Range | 61.0% | 74.6% |
| Mean | 50.2% | 52.3% |
| Median | 46.6% | 49.0% |
| Interquartile 25% (IQ1) | 44.2% | 46.7% |
| Interquartile 75% (IQ3) | 51.0% | 55.5% |
| Interquartile Range (IQR) | 6.8% | 8.8% |
| Standard Deviation (Sample) | 12.2% | 13.7% |
| Standard Deviation (Population) | 12.0% | 13.5% |
Similar Demographics by Disability Age Over 75
Demographics Similar to Immigrants from Zaire by Disability Age Over 75
In terms of disability age over 75, the demographic groups most similar to Immigrants from Zaire are Immigrants from Belarus (47.1%, a difference of 0.0%), Immigrants from Iran (47.1%, a difference of 0.010%), Arab (47.1%, a difference of 0.040%), Immigrants from Asia (47.0%, a difference of 0.050%), and Bhutanese (47.1%, a difference of 0.070%).
| Demographics | Rating | Rank | Disability Age Over 75 |
| Guyanese | 84.3 /100 | #146 | Excellent 46.9% |
| Immigrants | Peru | 84.1 /100 | #147 | Excellent 46.9% |
| Asians | 81.6 /100 | #148 | Excellent 46.9% |
| Welsh | 81.3 /100 | #149 | Excellent 47.0% |
| Immigrants | Russia | 79.3 /100 | #150 | Good 47.0% |
| French Canadians | 79.0 /100 | #151 | Good 47.0% |
| Immigrants | Asia | 76.5 /100 | #152 | Good 47.0% |
| Immigrants | Zaire | 74.8 /100 | #153 | Good 47.1% |
| Immigrants | Belarus | 74.8 /100 | #154 | Good 47.1% |
| Immigrants | Iran | 74.7 /100 | #155 | Good 47.1% |
| Arabs | 73.3 /100 | #156 | Good 47.1% |
| Bhutanese | 72.6 /100 | #157 | Good 47.1% |
| Immigrants | Guyana | 71.9 /100 | #158 | Good 47.1% |
| Immigrants | Morocco | 71.4 /100 | #159 | Good 47.1% |
| Immigrants | Middle Africa | 68.3 /100 | #160 | Good 47.1% |
Demographics Similar to Immigrants from Kenya by Disability Age Over 75
In terms of disability age over 75, the demographic groups most similar to Immigrants from Kenya are Basque (47.6%, a difference of 0.0%), Immigrants from Sudan (47.5%, a difference of 0.020%), Sudanese (47.5%, a difference of 0.030%), Somali (47.6%, a difference of 0.040%), and Portuguese (47.6%, a difference of 0.040%).
| Demographics | Rating | Rank | Disability Age Over 75 |
| Immigrants | Moldova | 39.9 /100 | #182 | Fair 47.4% |
| Delaware | 39.1 /100 | #183 | Fair 47.5% |
| Immigrants | Nigeria | 34.0 /100 | #184 | Fair 47.5% |
| Ghanaians | 33.0 /100 | #185 | Fair 47.5% |
| Sudanese | 32.0 /100 | #186 | Fair 47.5% |
| Immigrants | Sudan | 31.8 /100 | #187 | Fair 47.5% |
| Basques | 30.9 /100 | #188 | Fair 47.6% |
| Immigrants | Kenya | 30.8 /100 | #189 | Fair 47.6% |
| Somalis | 29.5 /100 | #190 | Fair 47.6% |
| Portuguese | 29.3 /100 | #191 | Fair 47.6% |
| Immigrants | Jamaica | 28.3 /100 | #192 | Fair 47.6% |
| Ottawa | 28.1 /100 | #193 | Fair 47.6% |
| Immigrants | Lebanon | 26.5 /100 | #194 | Fair 47.6% |
| Immigrants | Trinidad and Tobago | 25.3 /100 | #195 | Fair 47.6% |
| Immigrants | Portugal | 23.8 /100 | #196 | Fair 47.6% |