Portuguese vs Immigrants from Cameroon Vision Disability
COMPARE
Portuguese
Immigrants from Cameroon
Vision Disability
Vision Disability Comparison
Portuguese
Immigrants from Cameroon
2.3%
VISION DISABILITY
4.9/ 100
METRIC RATING
218th/ 347
METRIC RANK
2.1%
VISION DISABILITY
88.8/ 100
METRIC RATING
129th/ 347
METRIC RANK
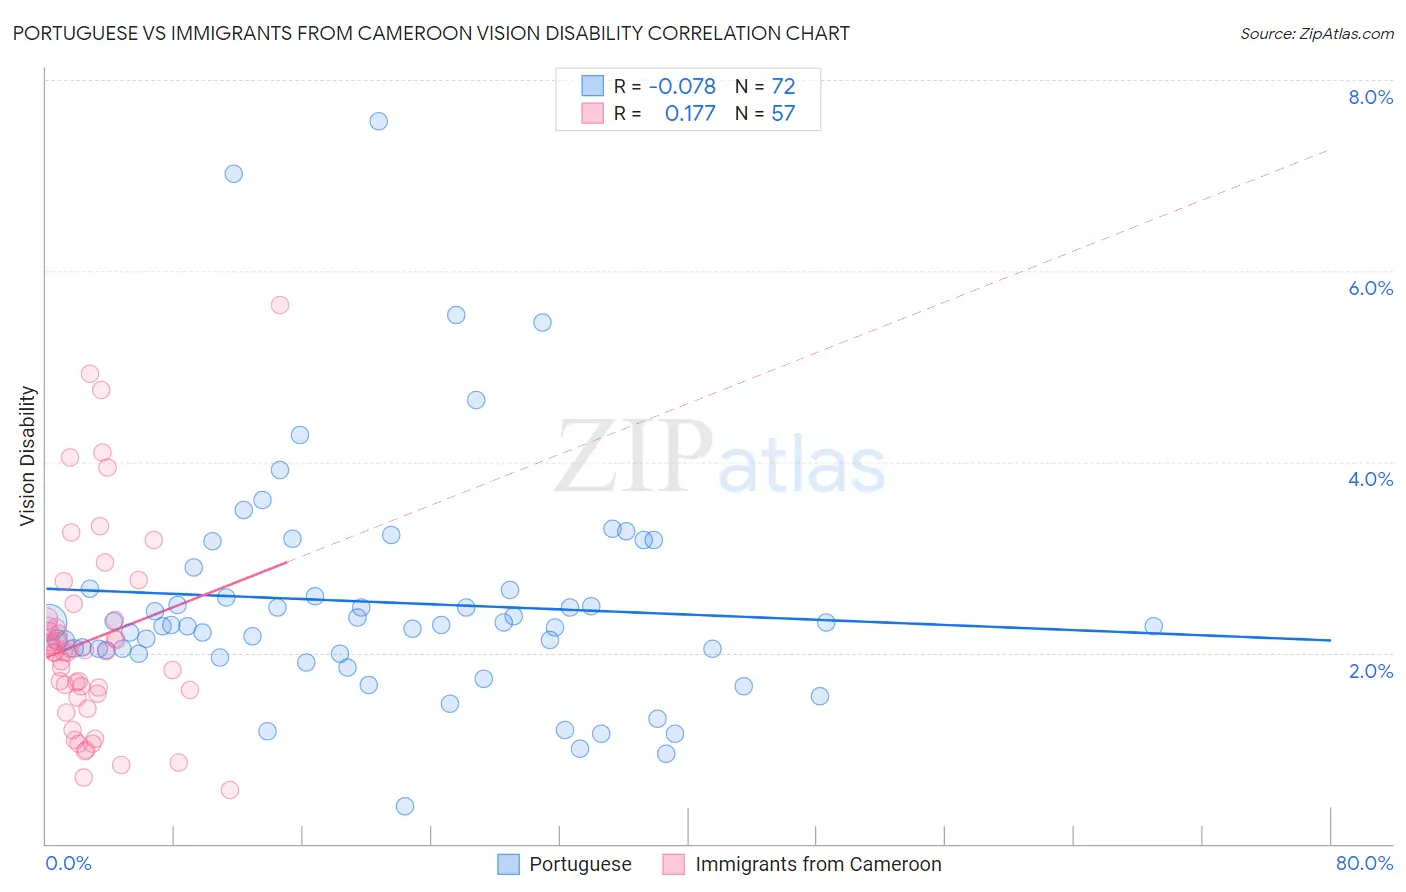
Portuguese vs Immigrants from Cameroon Vision Disability Correlation Chart
The statistical analysis conducted on geographies consisting of 449,734,569 people shows a slight negative correlation between the proportion of Portuguese and percentage of population with vision disability in the United States with a correlation coefficient (R) of -0.078 and weighted average of 2.3%. Similarly, the statistical analysis conducted on geographies consisting of 130,705,154 people shows a poor positive correlation between the proportion of Immigrants from Cameroon and percentage of population with vision disability in the United States with a correlation coefficient (R) of 0.177 and weighted average of 2.1%, a difference of 8.2%.
Vision Disability Correlation Summary
| Measurement | Portuguese | Immigrants from Cameroon |
| Minimum | 0.39% | 0.56% |
| Maximum | 7.6% | 5.6% |
| Range | 7.2% | 5.1% |
| Mean | 2.5% | 2.1% |
| Median | 2.3% | 2.0% |
| Interquartile 25% (IQ1) | 2.0% | 1.6% |
| Interquartile 75% (IQ3) | 2.7% | 2.3% |
| Interquartile Range (IQR) | 0.65% | 0.79% |
| Standard Deviation (Sample) | 1.2% | 1.1% |
| Standard Deviation (Population) | 1.2% | 1.1% |
Similar Demographics by Vision Disability
Demographics Similar to Portuguese by Vision Disability
In terms of vision disability, the demographic groups most similar to Portuguese are Barbadian (2.3%, a difference of 0.070%), Ecuadorian (2.3%, a difference of 0.11%), Immigrants from Trinidad and Tobago (2.3%, a difference of 0.34%), Guamanian/Chamorro (2.3%, a difference of 0.35%), and French Canadian (2.3%, a difference of 0.36%).
| Demographics | Rating | Rank | Vision Disability |
| Indonesians | 9.5 /100 | #211 | Tragic 2.2% |
| Bermudans | 9.0 /100 | #212 | Tragic 2.2% |
| Immigrants | Ghana | 8.9 /100 | #213 | Tragic 2.2% |
| Trinidadians and Tobagonians | 8.2 /100 | #214 | Tragic 2.2% |
| Nigerians | 7.2 /100 | #215 | Tragic 2.3% |
| Immigrants | Trinidad and Tobago | 6.1 /100 | #216 | Tragic 2.3% |
| Barbadians | 5.1 /100 | #217 | Tragic 2.3% |
| Portuguese | 4.9 /100 | #218 | Tragic 2.3% |
| Ecuadorians | 4.6 /100 | #219 | Tragic 2.3% |
| Guamanians/Chamorros | 3.9 /100 | #220 | Tragic 2.3% |
| French Canadians | 3.9 /100 | #221 | Tragic 2.3% |
| Immigrants | Senegal | 3.8 /100 | #222 | Tragic 2.3% |
| Basques | 3.5 /100 | #223 | Tragic 2.3% |
| Irish | 3.4 /100 | #224 | Tragic 2.3% |
| Immigrants | Western Africa | 3.4 /100 | #225 | Tragic 2.3% |
Demographics Similar to Immigrants from Cameroon by Vision Disability
In terms of vision disability, the demographic groups most similar to Immigrants from Cameroon are Immigrants from Kenya (2.1%, a difference of 0.010%), Immigrants from Hungary (2.1%, a difference of 0.020%), Immigrants from Chile (2.1%, a difference of 0.030%), Sudanese (2.1%, a difference of 0.070%), and New Zealander (2.1%, a difference of 0.10%).
| Demographics | Rating | Rank | Vision Disability |
| Immigrants | Ukraine | 90.4 /100 | #122 | Exceptional 2.1% |
| Immigrants | Albania | 90.4 /100 | #123 | Exceptional 2.1% |
| Immigrants | Spain | 89.8 /100 | #124 | Excellent 2.1% |
| Immigrants | Venezuela | 89.8 /100 | #125 | Excellent 2.1% |
| Immigrants | Peru | 89.5 /100 | #126 | Excellent 2.1% |
| Sudanese | 89.2 /100 | #127 | Excellent 2.1% |
| Immigrants | Chile | 89.0 /100 | #128 | Excellent 2.1% |
| Immigrants | Cameroon | 88.8 /100 | #129 | Excellent 2.1% |
| Immigrants | Kenya | 88.7 /100 | #130 | Excellent 2.1% |
| Immigrants | Hungary | 88.7 /100 | #131 | Excellent 2.1% |
| New Zealanders | 88.2 /100 | #132 | Excellent 2.1% |
| Syrians | 87.5 /100 | #133 | Excellent 2.1% |
| Venezuelans | 87.2 /100 | #134 | Excellent 2.1% |
| Vietnamese | 86.7 /100 | #135 | Excellent 2.1% |
| Czechs | 86.3 /100 | #136 | Excellent 2.1% |