Colombian vs Immigrants from Middle Africa Vision Disability
COMPARE
Colombian
Immigrants from Middle Africa
Vision Disability
Vision Disability Comparison
Colombians
Immigrants from Middle Africa
2.1%
VISION DISABILITY
76.2/ 100
METRIC RATING
149th/ 347
METRIC RANK
2.2%
VISION DISABILITY
33.5/ 100
METRIC RATING
185th/ 347
METRIC RANK
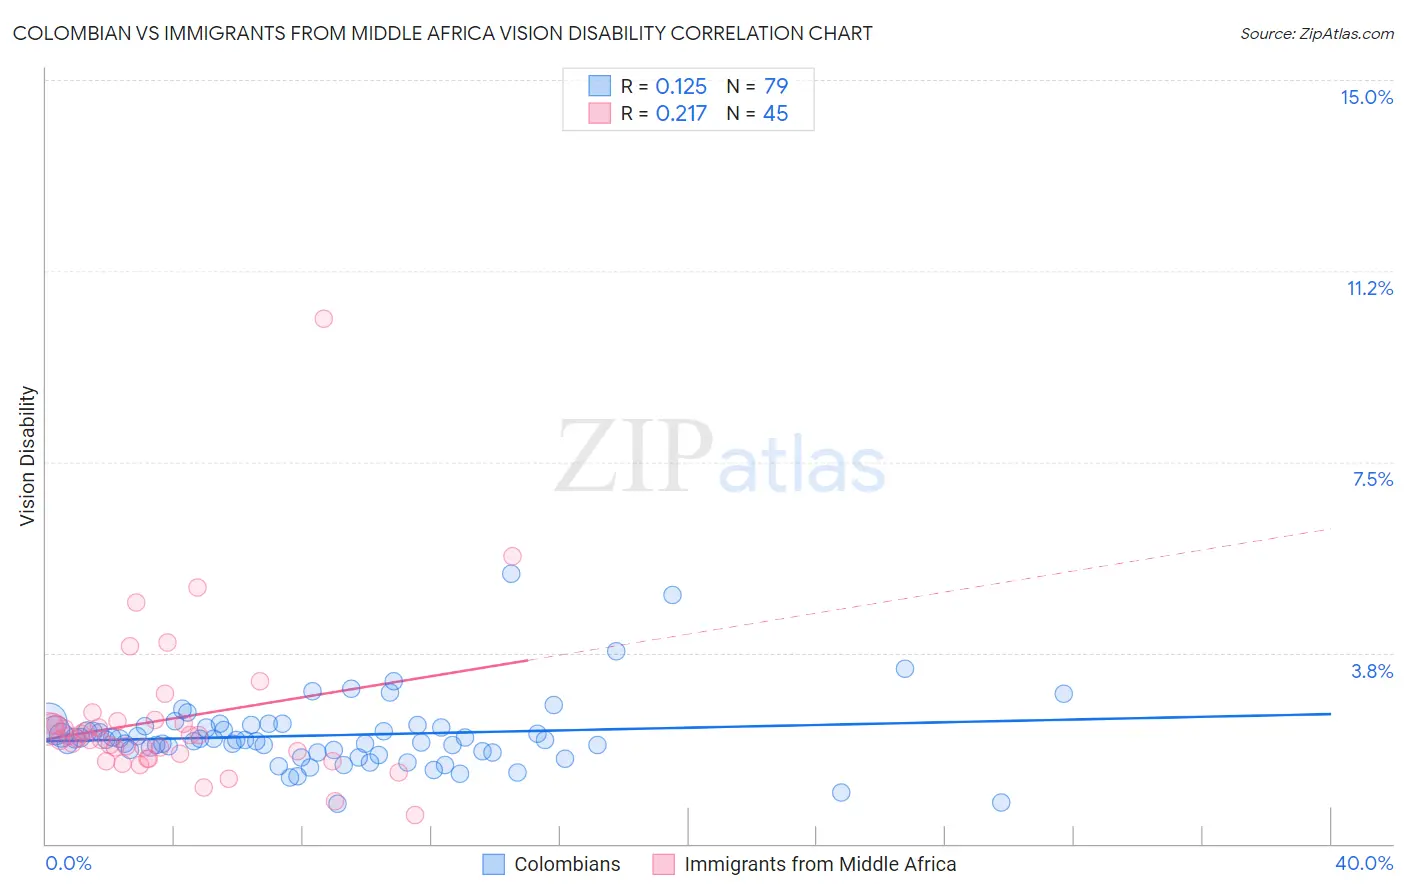
Colombian vs Immigrants from Middle Africa Vision Disability Correlation Chart
The statistical analysis conducted on geographies consisting of 419,253,931 people shows a poor positive correlation between the proportion of Colombians and percentage of population with vision disability in the United States with a correlation coefficient (R) of 0.125 and weighted average of 2.1%. Similarly, the statistical analysis conducted on geographies consisting of 202,642,272 people shows a weak positive correlation between the proportion of Immigrants from Middle Africa and percentage of population with vision disability in the United States with a correlation coefficient (R) of 0.217 and weighted average of 2.2%, a difference of 3.0%.
Vision Disability Correlation Summary
| Measurement | Colombian | Immigrants from Middle Africa |
| Minimum | 0.78% | 0.56% |
| Maximum | 5.3% | 10.3% |
| Range | 4.5% | 9.7% |
| Mean | 2.1% | 2.4% |
| Median | 2.0% | 2.1% |
| Interquartile 25% (IQ1) | 1.8% | 1.7% |
| Interquartile 75% (IQ3) | 2.3% | 2.4% |
| Interquartile Range (IQR) | 0.52% | 0.66% |
| Standard Deviation (Sample) | 0.71% | 1.6% |
| Standard Deviation (Population) | 0.70% | 1.5% |
Similar Demographics by Vision Disability
Demographics Similar to Colombians by Vision Disability
In terms of vision disability, the demographic groups most similar to Colombians are Belgian (2.1%, a difference of 0.030%), Immigrants from Norway (2.1%, a difference of 0.070%), Immigrants from Southern Europe (2.1%, a difference of 0.14%), Finnish (2.1%, a difference of 0.19%), and Immigrants from Sudan (2.1%, a difference of 0.20%).
| Demographics | Rating | Rank | Vision Disability |
| South Americans | 82.8 /100 | #142 | Excellent 2.1% |
| Immigrants | Sierra Leone | 82.8 /100 | #143 | Excellent 2.1% |
| Ukrainians | 81.9 /100 | #144 | Excellent 2.1% |
| Immigrants | Bosnia and Herzegovina | 81.5 /100 | #145 | Excellent 2.1% |
| Italians | 79.7 /100 | #146 | Good 2.1% |
| Immigrants | Sudan | 78.4 /100 | #147 | Good 2.1% |
| Finns | 78.3 /100 | #148 | Good 2.1% |
| Colombians | 76.2 /100 | #149 | Good 2.1% |
| Belgians | 75.9 /100 | #150 | Good 2.1% |
| Immigrants | Norway | 75.5 /100 | #151 | Good 2.1% |
| Immigrants | Southern Europe | 74.6 /100 | #152 | Good 2.1% |
| Immigrants | South America | 73.8 /100 | #153 | Good 2.1% |
| Slovenes | 73.6 /100 | #154 | Good 2.1% |
| Immigrants | Colombia | 72.1 /100 | #155 | Good 2.1% |
| Pakistanis | 71.6 /100 | #156 | Good 2.1% |
Demographics Similar to Immigrants from Middle Africa by Vision Disability
In terms of vision disability, the demographic groups most similar to Immigrants from Middle Africa are Native Hawaiian (2.2%, a difference of 0.020%), Moroccan (2.2%, a difference of 0.13%), Immigrants from St. Vincent and the Grenadines (2.2%, a difference of 0.23%), Immigrants from Burma/Myanmar (2.2%, a difference of 0.30%), and Guyanese (2.2%, a difference of 0.34%).
| Demographics | Rating | Rank | Vision Disability |
| Immigrants | Oceania | 45.1 /100 | #178 | Average 2.2% |
| Immigrants | North America | 44.5 /100 | #179 | Average 2.2% |
| Uruguayans | 42.7 /100 | #180 | Average 2.2% |
| Immigrants | Western Europe | 41.1 /100 | #181 | Average 2.2% |
| Costa Ricans | 40.7 /100 | #182 | Average 2.2% |
| Immigrants | Burma/Myanmar | 37.9 /100 | #183 | Fair 2.2% |
| Moroccans | 35.4 /100 | #184 | Fair 2.2% |
| Immigrants | Middle Africa | 33.5 /100 | #185 | Fair 2.2% |
| Native Hawaiians | 33.3 /100 | #186 | Fair 2.2% |
| Immigrants | St. Vincent and the Grenadines | 30.3 /100 | #187 | Fair 2.2% |
| Guyanese | 28.9 /100 | #188 | Fair 2.2% |
| Salvadorans | 27.4 /100 | #189 | Fair 2.2% |
| Immigrants | Costa Rica | 26.1 /100 | #190 | Fair 2.2% |
| Canadians | 25.8 /100 | #191 | Fair 2.2% |
| Europeans | 25.7 /100 | #192 | Fair 2.2% |