Mongolian vs Immigrants from Middle Africa Vision Disability
COMPARE
Mongolian
Immigrants from Middle Africa
Vision Disability
Vision Disability Comparison
Mongolians
Immigrants from Middle Africa
1.9%
VISION DISABILITY
99.9/ 100
METRIC RATING
31st/ 347
METRIC RANK
2.2%
VISION DISABILITY
33.5/ 100
METRIC RATING
185th/ 347
METRIC RANK
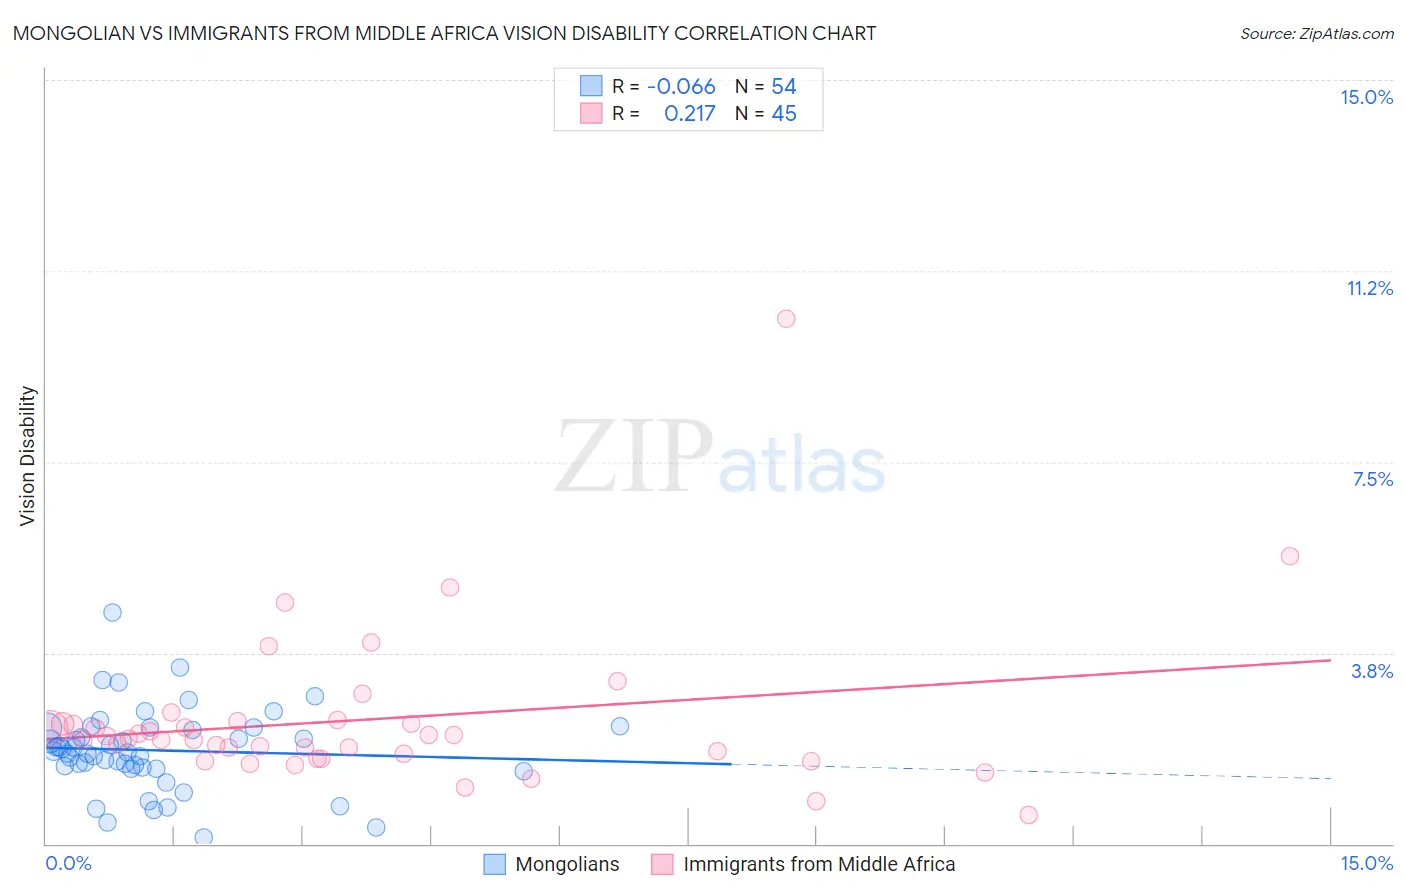
Mongolian vs Immigrants from Middle Africa Vision Disability Correlation Chart
The statistical analysis conducted on geographies consisting of 140,326,151 people shows a slight negative correlation between the proportion of Mongolians and percentage of population with vision disability in the United States with a correlation coefficient (R) of -0.066 and weighted average of 1.9%. Similarly, the statistical analysis conducted on geographies consisting of 202,642,272 people shows a weak positive correlation between the proportion of Immigrants from Middle Africa and percentage of population with vision disability in the United States with a correlation coefficient (R) of 0.217 and weighted average of 2.2%, a difference of 13.3%.
Vision Disability Correlation Summary
| Measurement | Mongolian | Immigrants from Middle Africa |
| Minimum | 0.13% | 0.56% |
| Maximum | 4.5% | 10.3% |
| Range | 4.4% | 9.7% |
| Mean | 1.8% | 2.4% |
| Median | 1.8% | 2.1% |
| Interquartile 25% (IQ1) | 1.5% | 1.7% |
| Interquartile 75% (IQ3) | 2.3% | 2.4% |
| Interquartile Range (IQR) | 0.76% | 0.66% |
| Standard Deviation (Sample) | 0.81% | 1.6% |
| Standard Deviation (Population) | 0.80% | 1.5% |
Similar Demographics by Vision Disability
Demographics Similar to Mongolians by Vision Disability
In terms of vision disability, the demographic groups most similar to Mongolians are Immigrants from Nepal (1.9%, a difference of 0.17%), Egyptian (1.9%, a difference of 0.20%), Immigrants from Malaysia (1.9%, a difference of 0.27%), Luxembourger (1.9%, a difference of 0.27%), and Taiwanese (1.9%, a difference of 0.29%).
| Demographics | Rating | Rank | Vision Disability |
| Immigrants | Lithuania | 99.9 /100 | #24 | Exceptional 1.9% |
| Bulgarians | 99.9 /100 | #25 | Exceptional 1.9% |
| Immigrants | Japan | 99.9 /100 | #26 | Exceptional 1.9% |
| Taiwanese | 99.9 /100 | #27 | Exceptional 1.9% |
| Immigrants | Malaysia | 99.9 /100 | #28 | Exceptional 1.9% |
| Egyptians | 99.9 /100 | #29 | Exceptional 1.9% |
| Immigrants | Nepal | 99.9 /100 | #30 | Exceptional 1.9% |
| Mongolians | 99.9 /100 | #31 | Exceptional 1.9% |
| Luxembourgers | 99.9 /100 | #32 | Exceptional 1.9% |
| Immigrants | Egypt | 99.9 /100 | #33 | Exceptional 1.9% |
| Immigrants | Turkey | 99.8 /100 | #34 | Exceptional 1.9% |
| Immigrants | Australia | 99.8 /100 | #35 | Exceptional 1.9% |
| Cambodians | 99.8 /100 | #36 | Exceptional 2.0% |
| Bhutanese | 99.8 /100 | #37 | Exceptional 2.0% |
| Immigrants | Kuwait | 99.8 /100 | #38 | Exceptional 2.0% |
Demographics Similar to Immigrants from Middle Africa by Vision Disability
In terms of vision disability, the demographic groups most similar to Immigrants from Middle Africa are Native Hawaiian (2.2%, a difference of 0.020%), Moroccan (2.2%, a difference of 0.13%), Immigrants from St. Vincent and the Grenadines (2.2%, a difference of 0.23%), Immigrants from Burma/Myanmar (2.2%, a difference of 0.30%), and Guyanese (2.2%, a difference of 0.34%).
| Demographics | Rating | Rank | Vision Disability |
| Immigrants | Oceania | 45.1 /100 | #178 | Average 2.2% |
| Immigrants | North America | 44.5 /100 | #179 | Average 2.2% |
| Uruguayans | 42.7 /100 | #180 | Average 2.2% |
| Immigrants | Western Europe | 41.1 /100 | #181 | Average 2.2% |
| Costa Ricans | 40.7 /100 | #182 | Average 2.2% |
| Immigrants | Burma/Myanmar | 37.9 /100 | #183 | Fair 2.2% |
| Moroccans | 35.4 /100 | #184 | Fair 2.2% |
| Immigrants | Middle Africa | 33.5 /100 | #185 | Fair 2.2% |
| Native Hawaiians | 33.3 /100 | #186 | Fair 2.2% |
| Immigrants | St. Vincent and the Grenadines | 30.3 /100 | #187 | Fair 2.2% |
| Guyanese | 28.9 /100 | #188 | Fair 2.2% |
| Salvadorans | 27.4 /100 | #189 | Fair 2.2% |
| Immigrants | Costa Rica | 26.1 /100 | #190 | Fair 2.2% |
| Canadians | 25.8 /100 | #191 | Fair 2.2% |
| Europeans | 25.7 /100 | #192 | Fair 2.2% |