Polish vs Celtic Hearing Disability
COMPARE
Polish
Celtic
Hearing Disability
Hearing Disability Comparison
Poles
Celtics
3.4%
HEARING DISABILITY
0.2/ 100
METRIC RATING
255th/ 347
METRIC RANK
3.7%
HEARING DISABILITY
0.0/ 100
METRIC RATING
298th/ 347
METRIC RANK
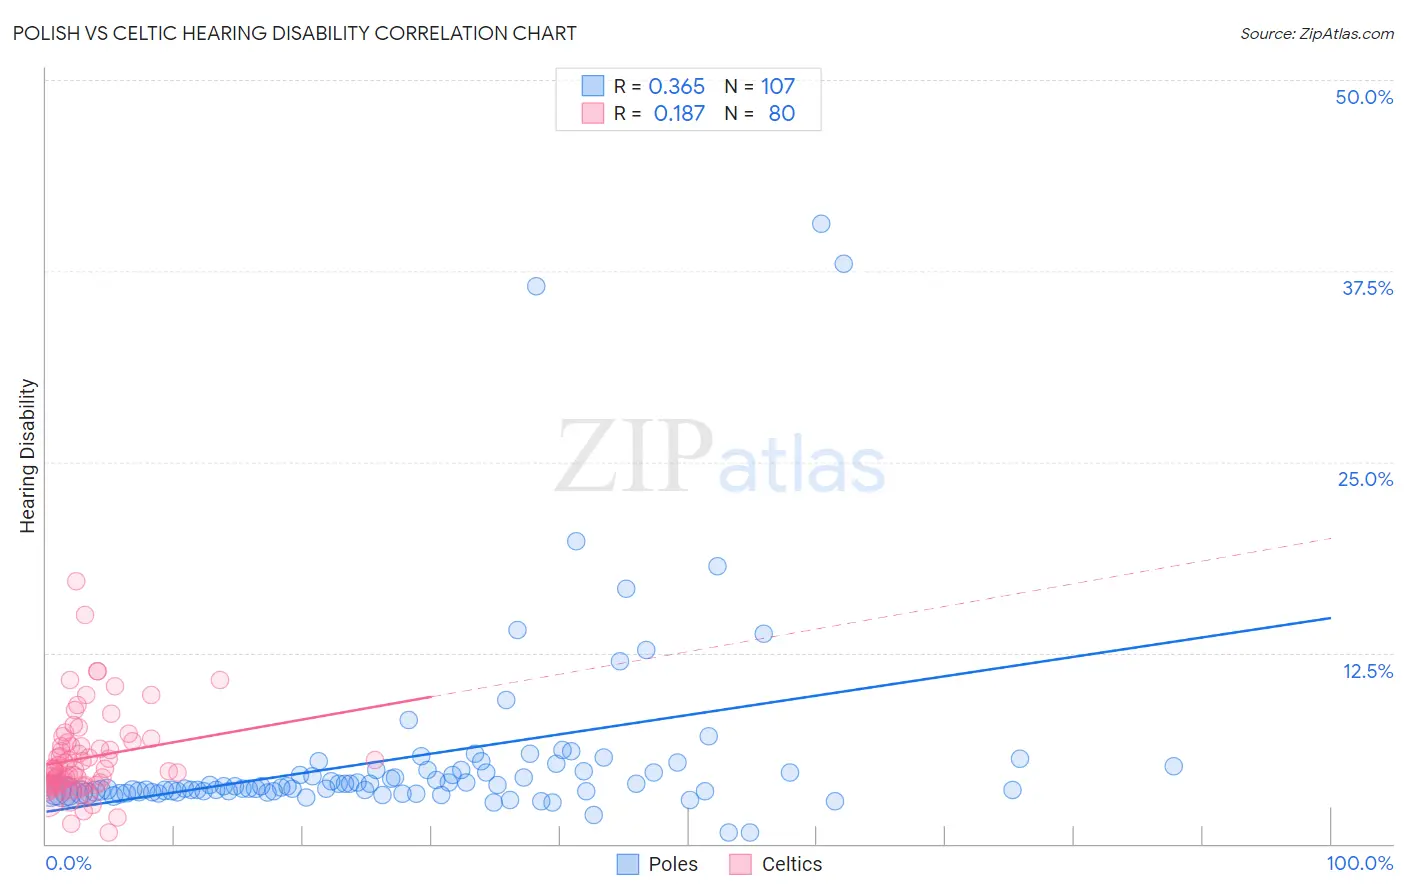
Polish vs Celtic Hearing Disability Correlation Chart
The statistical analysis conducted on geographies consisting of 559,927,295 people shows a mild positive correlation between the proportion of Poles and percentage of population with hearing disability in the United States with a correlation coefficient (R) of 0.365 and weighted average of 3.4%. Similarly, the statistical analysis conducted on geographies consisting of 168,857,428 people shows a poor positive correlation between the proportion of Celtics and percentage of population with hearing disability in the United States with a correlation coefficient (R) of 0.187 and weighted average of 3.7%, a difference of 8.6%.
Hearing Disability Correlation Summary
| Measurement | Polish | Celtic |
| Minimum | 0.74% | 0.76% |
| Maximum | 40.6% | 17.2% |
| Range | 39.8% | 16.4% |
| Mean | 5.7% | 5.6% |
| Median | 3.7% | 4.9% |
| Interquartile 25% (IQ1) | 3.4% | 3.9% |
| Interquartile 75% (IQ3) | 4.8% | 6.5% |
| Interquartile Range (IQR) | 1.4% | 2.6% |
| Standard Deviation (Sample) | 6.4% | 2.8% |
| Standard Deviation (Population) | 6.4% | 2.8% |
Similar Demographics by Hearing Disability
Demographics Similar to Poles by Hearing Disability
In terms of hearing disability, the demographic groups most similar to Poles are Hmong (3.4%, a difference of 0.040%), Slavic (3.4%, a difference of 0.23%), Yaqui (3.4%, a difference of 0.49%), Northern European (3.4%, a difference of 0.56%), and Carpatho Rusyn (3.4%, a difference of 0.65%).
| Demographics | Rating | Rank | Hearing Disability |
| Austrians | 0.6 /100 | #248 | Tragic 3.4% |
| Italians | 0.4 /100 | #249 | Tragic 3.4% |
| Yuman | 0.4 /100 | #250 | Tragic 3.4% |
| Hungarians | 0.4 /100 | #251 | Tragic 3.4% |
| Croatians | 0.4 /100 | #252 | Tragic 3.4% |
| Carpatho Rusyns | 0.3 /100 | #253 | Tragic 3.4% |
| Slavs | 0.2 /100 | #254 | Tragic 3.4% |
| Poles | 0.2 /100 | #255 | Tragic 3.4% |
| Hmong | 0.2 /100 | #256 | Tragic 3.4% |
| Yaqui | 0.2 /100 | #257 | Tragic 3.4% |
| Northern Europeans | 0.2 /100 | #258 | Tragic 3.4% |
| Slovenes | 0.1 /100 | #259 | Tragic 3.5% |
| Portuguese | 0.1 /100 | #260 | Tragic 3.5% |
| Hawaiians | 0.1 /100 | #261 | Tragic 3.5% |
| Immigrants | North America | 0.1 /100 | #262 | Tragic 3.5% |
Demographics Similar to Celtics by Hearing Disability
In terms of hearing disability, the demographic groups most similar to Celtics are Immigrants from the Azores (3.7%, a difference of 0.19%), Pima (3.7%, a difference of 0.26%), German (3.7%, a difference of 0.28%), Scottish (3.7%, a difference of 0.34%), and Pennsylvania German (3.7%, a difference of 0.37%).
| Demographics | Rating | Rank | Hearing Disability |
| Finns | 0.0 /100 | #291 | Tragic 3.7% |
| Native Hawaiians | 0.0 /100 | #292 | Tragic 3.7% |
| Norwegians | 0.0 /100 | #293 | Tragic 3.7% |
| Iroquois | 0.0 /100 | #294 | Tragic 3.7% |
| Welsh | 0.0 /100 | #295 | Tragic 3.7% |
| Pima | 0.0 /100 | #296 | Tragic 3.7% |
| Immigrants | Azores | 0.0 /100 | #297 | Tragic 3.7% |
| Celtics | 0.0 /100 | #298 | Tragic 3.7% |
| Germans | 0.0 /100 | #299 | Tragic 3.7% |
| Scottish | 0.0 /100 | #300 | Tragic 3.7% |
| Pennsylvania Germans | 0.0 /100 | #301 | Tragic 3.7% |
| Dutch | 0.0 /100 | #302 | Tragic 3.7% |
| Menominee | 0.0 /100 | #303 | Tragic 3.7% |
| French | 0.0 /100 | #304 | Tragic 3.8% |
| English | 0.0 /100 | #305 | Tragic 3.8% |