Polish vs Immigrants from West Indies Hearing Disability
COMPARE
Polish
Immigrants from West Indies
Hearing Disability
Hearing Disability Comparison
Poles
Immigrants from West Indies
3.4%
HEARING DISABILITY
0.2/ 100
METRIC RATING
255th/ 347
METRIC RANK
2.5%
HEARING DISABILITY
99.9/ 100
METRIC RATING
16th/ 347
METRIC RANK
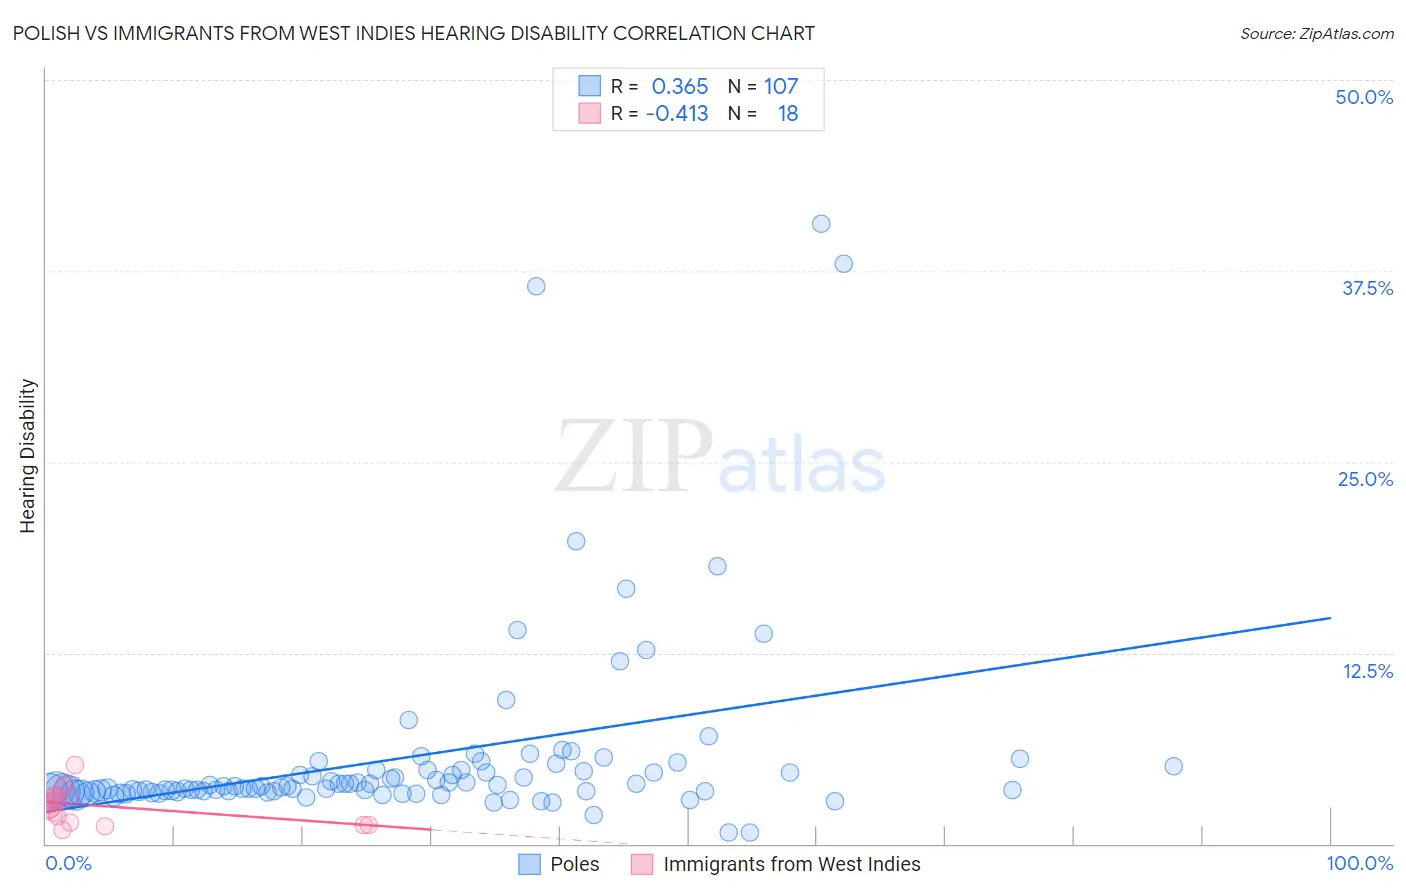
Polish vs Immigrants from West Indies Hearing Disability Correlation Chart
The statistical analysis conducted on geographies consisting of 559,927,295 people shows a mild positive correlation between the proportion of Poles and percentage of population with hearing disability in the United States with a correlation coefficient (R) of 0.365 and weighted average of 3.4%. Similarly, the statistical analysis conducted on geographies consisting of 72,456,124 people shows a moderate negative correlation between the proportion of Immigrants from West Indies and percentage of population with hearing disability in the United States with a correlation coefficient (R) of -0.413 and weighted average of 2.5%, a difference of 36.1%.
Hearing Disability Correlation Summary
| Measurement | Polish | Immigrants from West Indies |
| Minimum | 0.74% | 0.87% |
| Maximum | 40.6% | 5.2% |
| Range | 39.8% | 4.3% |
| Mean | 5.7% | 2.5% |
| Median | 3.7% | 2.6% |
| Interquartile 25% (IQ1) | 3.4% | 1.4% |
| Interquartile 75% (IQ3) | 4.8% | 3.0% |
| Interquartile Range (IQR) | 1.4% | 1.6% |
| Standard Deviation (Sample) | 6.4% | 1.1% |
| Standard Deviation (Population) | 6.4% | 1.1% |
Similar Demographics by Hearing Disability
Demographics Similar to Poles by Hearing Disability
In terms of hearing disability, the demographic groups most similar to Poles are Hmong (3.4%, a difference of 0.040%), Slavic (3.4%, a difference of 0.23%), Yaqui (3.4%, a difference of 0.49%), Northern European (3.4%, a difference of 0.56%), and Carpatho Rusyn (3.4%, a difference of 0.65%).
| Demographics | Rating | Rank | Hearing Disability |
| Austrians | 0.6 /100 | #248 | Tragic 3.4% |
| Italians | 0.4 /100 | #249 | Tragic 3.4% |
| Yuman | 0.4 /100 | #250 | Tragic 3.4% |
| Hungarians | 0.4 /100 | #251 | Tragic 3.4% |
| Croatians | 0.4 /100 | #252 | Tragic 3.4% |
| Carpatho Rusyns | 0.3 /100 | #253 | Tragic 3.4% |
| Slavs | 0.2 /100 | #254 | Tragic 3.4% |
| Poles | 0.2 /100 | #255 | Tragic 3.4% |
| Hmong | 0.2 /100 | #256 | Tragic 3.4% |
| Yaqui | 0.2 /100 | #257 | Tragic 3.4% |
| Northern Europeans | 0.2 /100 | #258 | Tragic 3.4% |
| Slovenes | 0.1 /100 | #259 | Tragic 3.5% |
| Portuguese | 0.1 /100 | #260 | Tragic 3.5% |
| Hawaiians | 0.1 /100 | #261 | Tragic 3.5% |
| Immigrants | North America | 0.1 /100 | #262 | Tragic 3.5% |
Demographics Similar to Immigrants from West Indies by Hearing Disability
In terms of hearing disability, the demographic groups most similar to Immigrants from West Indies are Barbadian (2.5%, a difference of 0.15%), Immigrants from India (2.5%, a difference of 0.32%), Ecuadorian (2.5%, a difference of 0.45%), Sierra Leonean (2.5%, a difference of 0.77%), and Trinidadian and Tobagonian (2.5%, a difference of 1.0%).
| Demographics | Rating | Rank | Hearing Disability |
| Immigrants | Dominican Republic | 100.0 /100 | #9 | Exceptional 2.4% |
| Immigrants | Ecuador | 99.9 /100 | #10 | Exceptional 2.5% |
| Immigrants | Trinidad and Tobago | 99.9 /100 | #11 | Exceptional 2.5% |
| Trinidadians and Tobagonians | 99.9 /100 | #12 | Exceptional 2.5% |
| Sierra Leoneans | 99.9 /100 | #13 | Exceptional 2.5% |
| Ecuadorians | 99.9 /100 | #14 | Exceptional 2.5% |
| Barbadians | 99.9 /100 | #15 | Exceptional 2.5% |
| Immigrants | West Indies | 99.9 /100 | #16 | Exceptional 2.5% |
| Immigrants | India | 99.9 /100 | #17 | Exceptional 2.5% |
| Dominicans | 99.8 /100 | #18 | Exceptional 2.5% |
| Thais | 99.8 /100 | #19 | Exceptional 2.5% |
| Immigrants | Bolivia | 99.8 /100 | #20 | Exceptional 2.5% |
| Ghanaians | 99.8 /100 | #21 | Exceptional 2.5% |
| Immigrants | Sierra Leone | 99.8 /100 | #22 | Exceptional 2.6% |
| Immigrants | Nigeria | 99.8 /100 | #23 | Exceptional 2.6% |