Peruvian vs Swedish Vision Disability
COMPARE
Peruvian
Swedish
Vision Disability
Vision Disability Comparison
Peruvians
Swedes
2.1%
VISION DISABILITY
93.5/ 100
METRIC RATING
111th/ 347
METRIC RANK
2.1%
VISION DISABILITY
94.2/ 100
METRIC RATING
106th/ 347
METRIC RANK
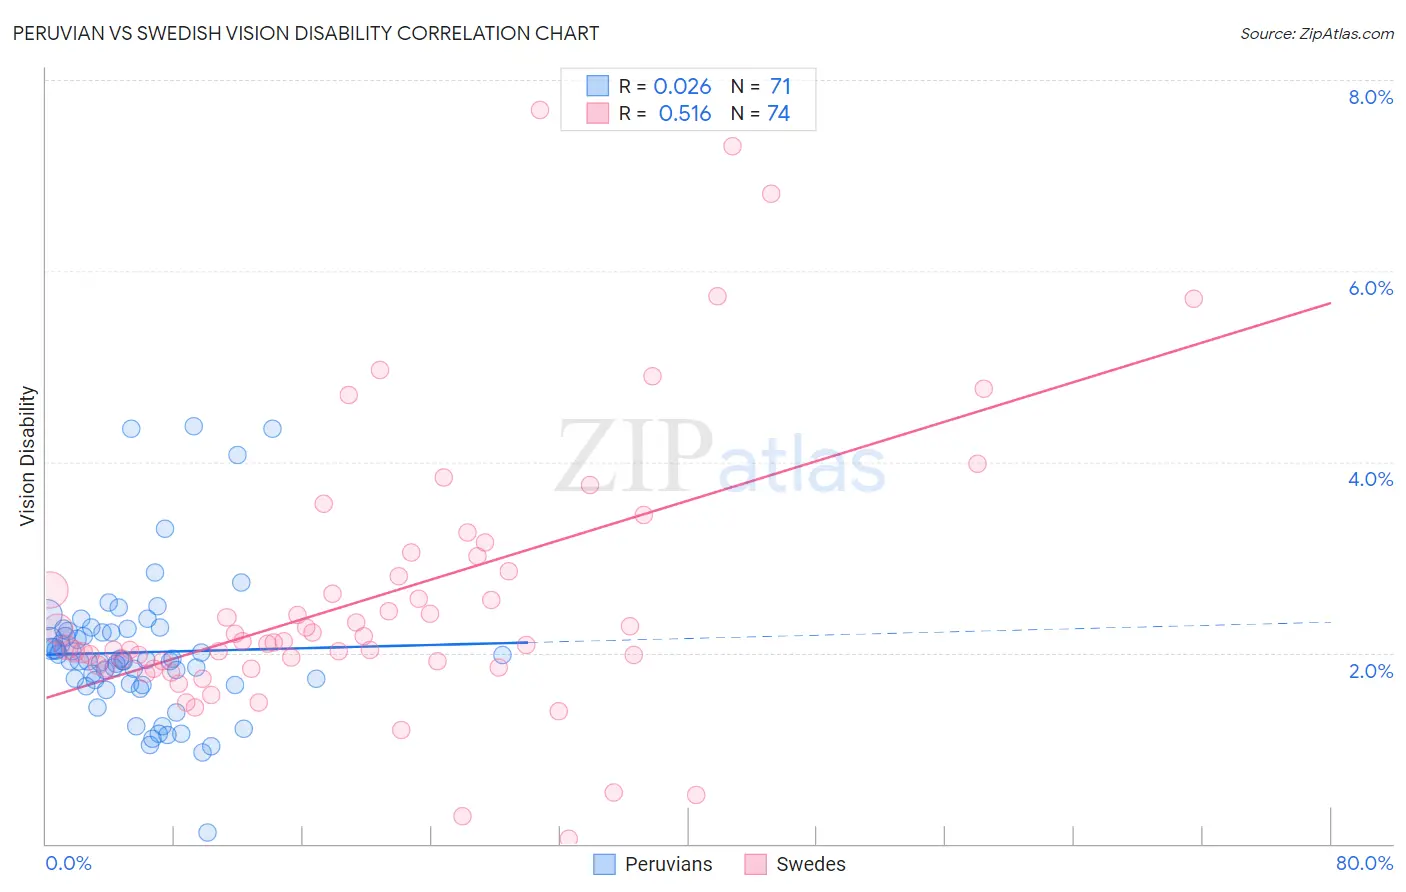
Peruvian vs Swedish Vision Disability Correlation Chart
The statistical analysis conducted on geographies consisting of 363,040,425 people shows no correlation between the proportion of Peruvians and percentage of population with vision disability in the United States with a correlation coefficient (R) of 0.026 and weighted average of 2.1%. Similarly, the statistical analysis conducted on geographies consisting of 537,778,731 people shows a substantial positive correlation between the proportion of Swedes and percentage of population with vision disability in the United States with a correlation coefficient (R) of 0.516 and weighted average of 2.1%, a difference of 0.18%.
Vision Disability Correlation Summary
| Measurement | Peruvian | Swedish |
| Minimum | 0.11% | 0.053% |
| Maximum | 4.4% | 7.7% |
| Range | 4.3% | 7.6% |
| Mean | 2.0% | 2.6% |
| Median | 1.9% | 2.1% |
| Interquartile 25% (IQ1) | 1.7% | 1.9% |
| Interquartile 75% (IQ3) | 2.2% | 2.9% |
| Interquartile Range (IQR) | 0.56% | 0.99% |
| Standard Deviation (Sample) | 0.75% | 1.5% |
| Standard Deviation (Population) | 0.74% | 1.4% |
Demographics Similar to Peruvians and Swedes by Vision Disability
In terms of vision disability, the demographic groups most similar to Peruvians are Immigrants from Armenia (2.1%, a difference of 0.060%), Chilean (2.1%, a difference of 0.13%), Korean (2.1%, a difference of 0.15%), Immigrants from Denmark (2.1%, a difference of 0.16%), and Danish (2.1%, a difference of 0.17%). Similarly, the demographic groups most similar to Swedes are Danish (2.1%, a difference of 0.010%), Korean (2.1%, a difference of 0.030%), Carpatho Rusyn (2.1%, a difference of 0.040%), Chilean (2.1%, a difference of 0.050%), and Immigrants from Italy (2.1%, a difference of 0.060%).
| Demographics | Rating | Rank | Vision Disability |
| Immigrants | South Africa | 95.4 /100 | #98 | Exceptional 2.1% |
| Estonians | 95.3 /100 | #99 | Exceptional 2.1% |
| Greeks | 95.1 /100 | #100 | Exceptional 2.1% |
| Albanians | 94.9 /100 | #101 | Exceptional 2.1% |
| Sri Lankans | 94.8 /100 | #102 | Exceptional 2.1% |
| Immigrants | Austria | 94.4 /100 | #103 | Exceptional 2.1% |
| Immigrants | Italy | 94.4 /100 | #104 | Exceptional 2.1% |
| Carpatho Rusyns | 94.3 /100 | #105 | Exceptional 2.1% |
| Swedes | 94.2 /100 | #106 | Exceptional 2.1% |
| Danes | 94.2 /100 | #107 | Exceptional 2.1% |
| Koreans | 94.1 /100 | #108 | Exceptional 2.1% |
| Chileans | 94.0 /100 | #109 | Exceptional 2.1% |
| Immigrants | Armenia | 93.8 /100 | #110 | Exceptional 2.1% |
| Peruvians | 93.5 /100 | #111 | Exceptional 2.1% |
| Immigrants | Denmark | 92.9 /100 | #112 | Exceptional 2.1% |
| Kenyans | 92.5 /100 | #113 | Exceptional 2.1% |
| Croatians | 92.3 /100 | #114 | Exceptional 2.1% |
| Immigrants | Vietnam | 92.2 /100 | #115 | Exceptional 2.1% |
| Ugandans | 92.2 /100 | #116 | Exceptional 2.1% |
| Poles | 92.0 /100 | #117 | Exceptional 2.1% |
| Immigrants | Philippines | 91.4 /100 | #118 | Exceptional 2.1% |