Immigrants from China vs Swedish Vision Disability
COMPARE
Immigrants from China
Swedish
Vision Disability
Vision Disability Comparison
Immigrants from China
Swedes
1.8%
VISION DISABILITY
100.0/ 100
METRIC RATING
14th/ 347
METRIC RANK
2.1%
VISION DISABILITY
94.2/ 100
METRIC RATING
106th/ 347
METRIC RANK
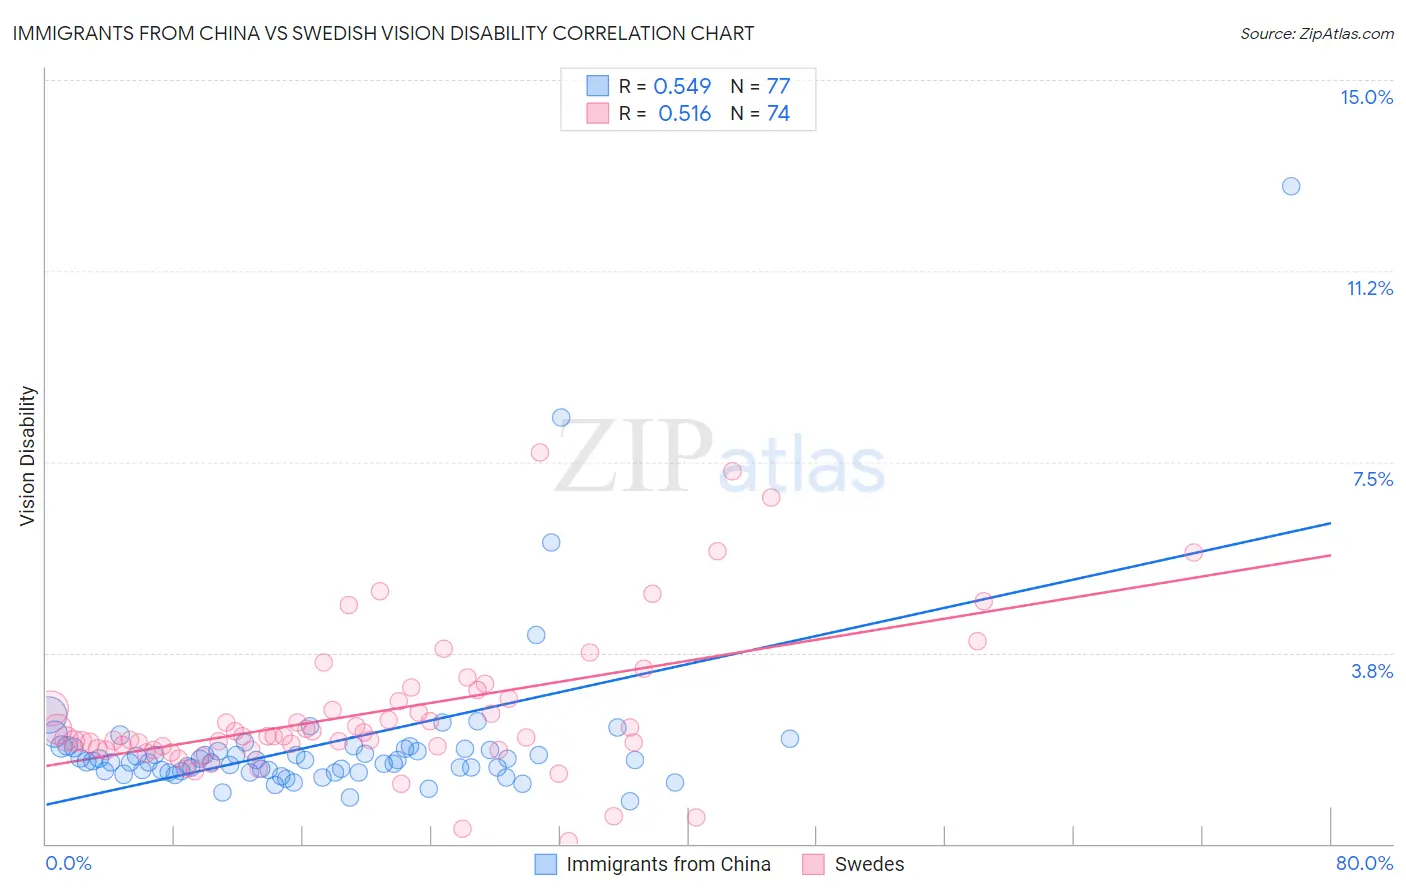
Immigrants from China vs Swedish Vision Disability Correlation Chart
The statistical analysis conducted on geographies consisting of 456,538,293 people shows a substantial positive correlation between the proportion of Immigrants from China and percentage of population with vision disability in the United States with a correlation coefficient (R) of 0.549 and weighted average of 1.8%. Similarly, the statistical analysis conducted on geographies consisting of 537,778,731 people shows a substantial positive correlation between the proportion of Swedes and percentage of population with vision disability in the United States with a correlation coefficient (R) of 0.516 and weighted average of 2.1%, a difference of 13.0%.
Vision Disability Correlation Summary
| Measurement | Immigrants from China | Swedish |
| Minimum | 0.84% | 0.053% |
| Maximum | 12.9% | 7.7% |
| Range | 12.1% | 7.6% |
| Mean | 1.9% | 2.6% |
| Median | 1.6% | 2.1% |
| Interquartile 25% (IQ1) | 1.4% | 1.9% |
| Interquartile 75% (IQ3) | 1.9% | 2.9% |
| Interquartile Range (IQR) | 0.43% | 0.99% |
| Standard Deviation (Sample) | 1.6% | 1.5% |
| Standard Deviation (Population) | 1.6% | 1.4% |
Similar Demographics by Vision Disability
Demographics Similar to Immigrants from China by Vision Disability
In terms of vision disability, the demographic groups most similar to Immigrants from China are Immigrants from Eastern Asia (1.8%, a difference of 0.15%), Immigrants from Korea (1.8%, a difference of 0.22%), Immigrants from Bolivia (1.8%, a difference of 0.42%), Immigrants from Israel (1.8%, a difference of 0.45%), and Indian (Asian) (1.8%, a difference of 0.87%).
| Demographics | Rating | Rank | Vision Disability |
| Immigrants | South Central Asia | 100.0 /100 | #7 | Exceptional 1.8% |
| Iranians | 100.0 /100 | #8 | Exceptional 1.8% |
| Immigrants | Singapore | 100.0 /100 | #9 | Exceptional 1.8% |
| Immigrants | Hong Kong | 100.0 /100 | #10 | Exceptional 1.8% |
| Immigrants | Israel | 100.0 /100 | #11 | Exceptional 1.8% |
| Immigrants | Korea | 100.0 /100 | #12 | Exceptional 1.8% |
| Immigrants | Eastern Asia | 100.0 /100 | #13 | Exceptional 1.8% |
| Immigrants | China | 100.0 /100 | #14 | Exceptional 1.8% |
| Immigrants | Bolivia | 100.0 /100 | #15 | Exceptional 1.8% |
| Indians (Asian) | 100.0 /100 | #16 | Exceptional 1.8% |
| Burmese | 100.0 /100 | #17 | Exceptional 1.8% |
| Bolivians | 100.0 /100 | #18 | Exceptional 1.9% |
| Immigrants | Sri Lanka | 100.0 /100 | #19 | Exceptional 1.9% |
| Asians | 100.0 /100 | #20 | Exceptional 1.9% |
| Turks | 100.0 /100 | #21 | Exceptional 1.9% |
Demographics Similar to Swedes by Vision Disability
In terms of vision disability, the demographic groups most similar to Swedes are Danish (2.1%, a difference of 0.010%), Korean (2.1%, a difference of 0.030%), Carpatho Rusyn (2.1%, a difference of 0.040%), Chilean (2.1%, a difference of 0.050%), and Immigrants from Italy (2.1%, a difference of 0.060%).
| Demographics | Rating | Rank | Vision Disability |
| Estonians | 95.3 /100 | #99 | Exceptional 2.1% |
| Greeks | 95.1 /100 | #100 | Exceptional 2.1% |
| Albanians | 94.9 /100 | #101 | Exceptional 2.1% |
| Sri Lankans | 94.8 /100 | #102 | Exceptional 2.1% |
| Immigrants | Austria | 94.4 /100 | #103 | Exceptional 2.1% |
| Immigrants | Italy | 94.4 /100 | #104 | Exceptional 2.1% |
| Carpatho Rusyns | 94.3 /100 | #105 | Exceptional 2.1% |
| Swedes | 94.2 /100 | #106 | Exceptional 2.1% |
| Danes | 94.2 /100 | #107 | Exceptional 2.1% |
| Koreans | 94.1 /100 | #108 | Exceptional 2.1% |
| Chileans | 94.0 /100 | #109 | Exceptional 2.1% |
| Immigrants | Armenia | 93.8 /100 | #110 | Exceptional 2.1% |
| Peruvians | 93.5 /100 | #111 | Exceptional 2.1% |
| Immigrants | Denmark | 92.9 /100 | #112 | Exceptional 2.1% |
| Kenyans | 92.5 /100 | #113 | Exceptional 2.1% |