Immigrants from Peru vs Swedish Vision Disability
COMPARE
Immigrants from Peru
Swedish
Vision Disability
Vision Disability Comparison
Immigrants from Peru
Swedes
2.1%
VISION DISABILITY
89.5/ 100
METRIC RATING
126th/ 347
METRIC RANK
2.1%
VISION DISABILITY
94.2/ 100
METRIC RATING
106th/ 347
METRIC RANK
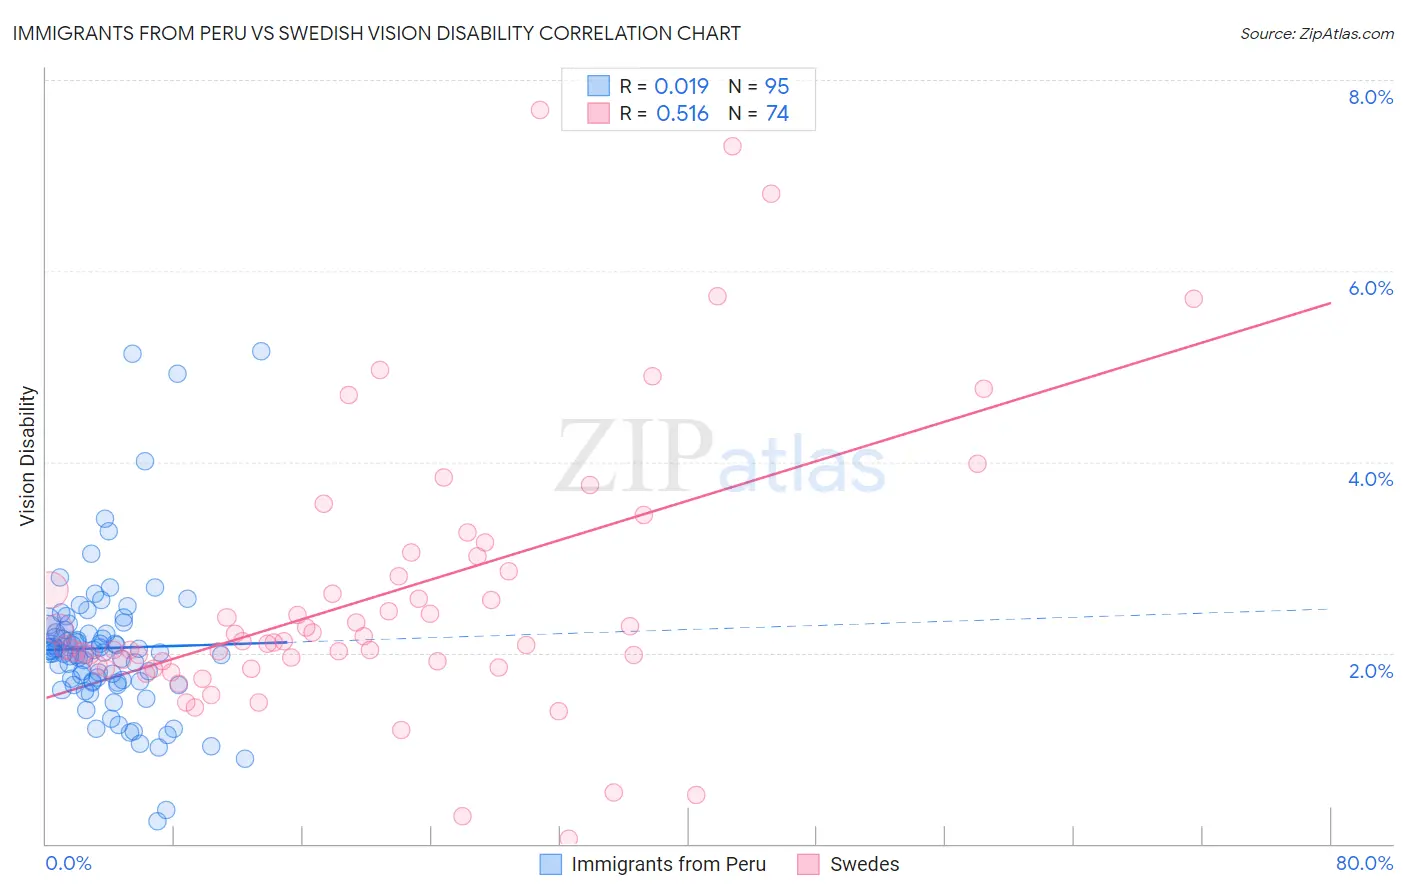
Immigrants from Peru vs Swedish Vision Disability Correlation Chart
The statistical analysis conducted on geographies consisting of 328,732,029 people shows no correlation between the proportion of Immigrants from Peru and percentage of population with vision disability in the United States with a correlation coefficient (R) of 0.019 and weighted average of 2.1%. Similarly, the statistical analysis conducted on geographies consisting of 537,778,731 people shows a substantial positive correlation between the proportion of Swedes and percentage of population with vision disability in the United States with a correlation coefficient (R) of 0.516 and weighted average of 2.1%, a difference of 1.1%.
Vision Disability Correlation Summary
| Measurement | Immigrants from Peru | Swedish |
| Minimum | 0.23% | 0.053% |
| Maximum | 5.2% | 7.7% |
| Range | 4.9% | 7.6% |
| Mean | 2.0% | 2.6% |
| Median | 2.0% | 2.1% |
| Interquartile 25% (IQ1) | 1.7% | 1.9% |
| Interquartile 75% (IQ3) | 2.2% | 2.9% |
| Interquartile Range (IQR) | 0.55% | 0.99% |
| Standard Deviation (Sample) | 0.79% | 1.5% |
| Standard Deviation (Population) | 0.78% | 1.4% |
Demographics Similar to Immigrants from Peru and Swedes by Vision Disability
In terms of vision disability, the demographic groups most similar to Immigrants from Peru are Immigrants from Spain (2.1%, a difference of 0.040%), Immigrants from Venezuela (2.1%, a difference of 0.040%), Immigrants from Ukraine (2.1%, a difference of 0.15%), Immigrants from Albania (2.1%, a difference of 0.15%), and Immigrants from Scotland (2.1%, a difference of 0.16%). Similarly, the demographic groups most similar to Swedes are Danish (2.1%, a difference of 0.010%), Korean (2.1%, a difference of 0.030%), Chilean (2.1%, a difference of 0.050%), Immigrants from Armenia (2.1%, a difference of 0.12%), and Peruvian (2.1%, a difference of 0.18%).
| Demographics | Rating | Rank | Vision Disability |
| Swedes | 94.2 /100 | #106 | Exceptional 2.1% |
| Danes | 94.2 /100 | #107 | Exceptional 2.1% |
| Koreans | 94.1 /100 | #108 | Exceptional 2.1% |
| Chileans | 94.0 /100 | #109 | Exceptional 2.1% |
| Immigrants | Armenia | 93.8 /100 | #110 | Exceptional 2.1% |
| Peruvians | 93.5 /100 | #111 | Exceptional 2.1% |
| Immigrants | Denmark | 92.9 /100 | #112 | Exceptional 2.1% |
| Kenyans | 92.5 /100 | #113 | Exceptional 2.1% |
| Croatians | 92.3 /100 | #114 | Exceptional 2.1% |
| Immigrants | Vietnam | 92.2 /100 | #115 | Exceptional 2.1% |
| Ugandans | 92.2 /100 | #116 | Exceptional 2.1% |
| Poles | 92.0 /100 | #117 | Exceptional 2.1% |
| Immigrants | Philippines | 91.4 /100 | #118 | Exceptional 2.1% |
| Immigrants | Uganda | 91.4 /100 | #119 | Exceptional 2.1% |
| Immigrants | Zimbabwe | 91.0 /100 | #120 | Exceptional 2.1% |
| Immigrants | Scotland | 90.4 /100 | #121 | Exceptional 2.1% |
| Immigrants | Ukraine | 90.4 /100 | #122 | Exceptional 2.1% |
| Immigrants | Albania | 90.4 /100 | #123 | Exceptional 2.1% |
| Immigrants | Spain | 89.8 /100 | #124 | Excellent 2.1% |
| Immigrants | Venezuela | 89.8 /100 | #125 | Excellent 2.1% |
| Immigrants | Peru | 89.5 /100 | #126 | Excellent 2.1% |