European vs Swedish Vision Disability
COMPARE
European
Swedish
Vision Disability
Vision Disability Comparison
Europeans
Swedes
2.2%
VISION DISABILITY
25.7/ 100
METRIC RATING
192nd/ 347
METRIC RANK
2.1%
VISION DISABILITY
94.2/ 100
METRIC RATING
106th/ 347
METRIC RANK
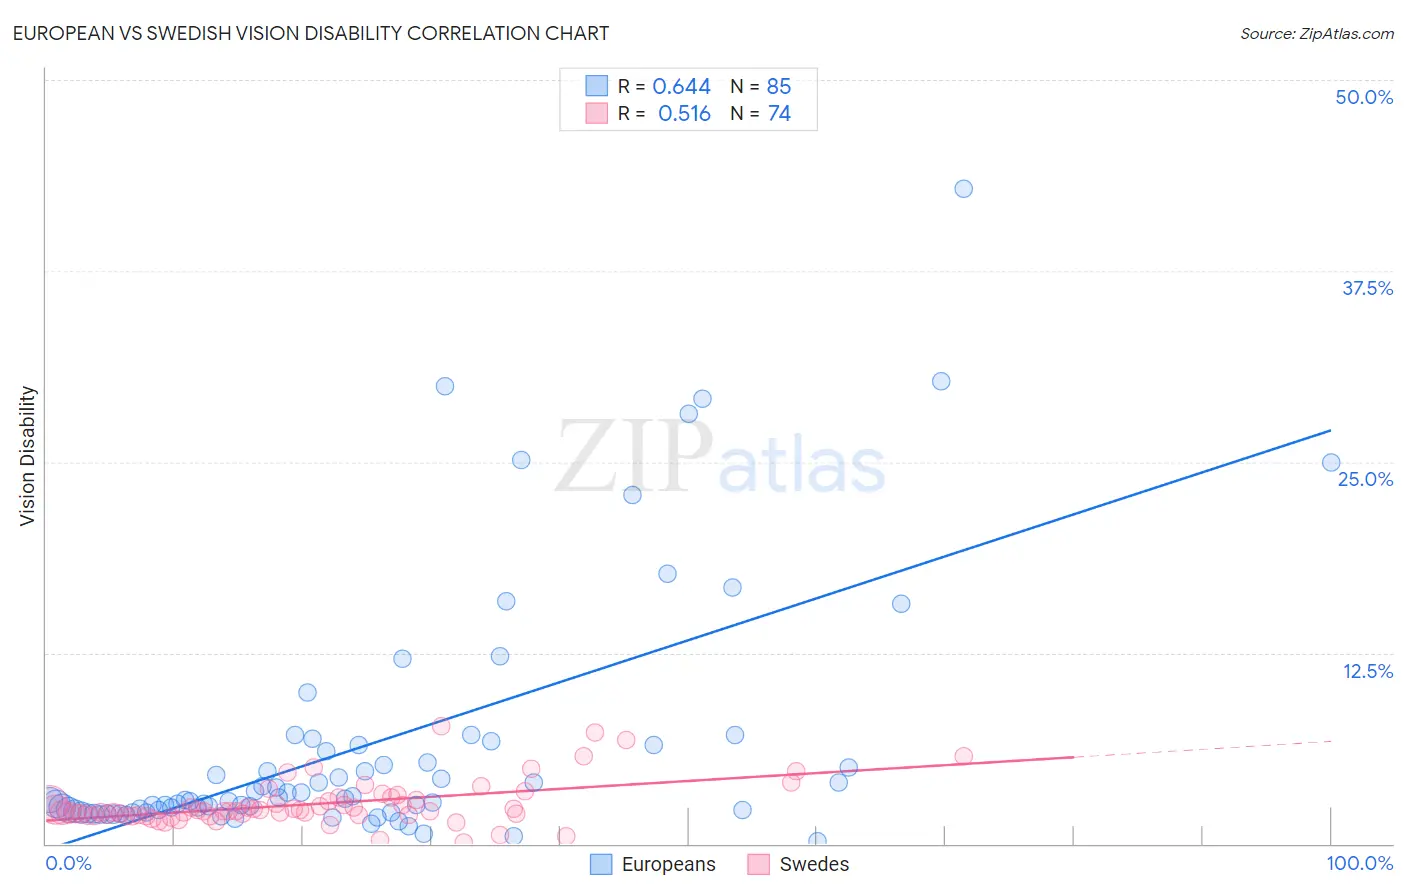
European vs Swedish Vision Disability Correlation Chart
The statistical analysis conducted on geographies consisting of 560,182,273 people shows a significant positive correlation between the proportion of Europeans and percentage of population with vision disability in the United States with a correlation coefficient (R) of 0.644 and weighted average of 2.2%. Similarly, the statistical analysis conducted on geographies consisting of 537,778,731 people shows a substantial positive correlation between the proportion of Swedes and percentage of population with vision disability in the United States with a correlation coefficient (R) of 0.516 and weighted average of 2.1%, a difference of 6.3%.
Vision Disability Correlation Summary
| Measurement | European | Swedish |
| Minimum | 0.14% | 0.053% |
| Maximum | 42.9% | 7.7% |
| Range | 42.7% | 7.6% |
| Mean | 6.5% | 2.6% |
| Median | 2.9% | 2.1% |
| Interquartile 25% (IQ1) | 2.1% | 1.9% |
| Interquartile 75% (IQ3) | 6.5% | 2.9% |
| Interquartile Range (IQR) | 4.4% | 0.99% |
| Standard Deviation (Sample) | 8.3% | 1.5% |
| Standard Deviation (Population) | 8.3% | 1.4% |
Similar Demographics by Vision Disability
Demographics Similar to Europeans by Vision Disability
In terms of vision disability, the demographic groups most similar to Europeans are Canadian (2.2%, a difference of 0.010%), Immigrants from Costa Rica (2.2%, a difference of 0.030%), British (2.2%, a difference of 0.050%), Salvadoran (2.2%, a difference of 0.13%), and Immigrants from Barbados (2.2%, a difference of 0.15%).
| Demographics | Rating | Rank | Vision Disability |
| Immigrants | Middle Africa | 33.5 /100 | #185 | Fair 2.2% |
| Native Hawaiians | 33.3 /100 | #186 | Fair 2.2% |
| Immigrants | St. Vincent and the Grenadines | 30.3 /100 | #187 | Fair 2.2% |
| Guyanese | 28.9 /100 | #188 | Fair 2.2% |
| Salvadorans | 27.4 /100 | #189 | Fair 2.2% |
| Immigrants | Costa Rica | 26.1 /100 | #190 | Fair 2.2% |
| Canadians | 25.8 /100 | #191 | Fair 2.2% |
| Europeans | 25.7 /100 | #192 | Fair 2.2% |
| British | 25.1 /100 | #193 | Fair 2.2% |
| Immigrants | Barbados | 24.0 /100 | #194 | Fair 2.2% |
| Immigrants | Immigrants | 23.7 /100 | #195 | Fair 2.2% |
| Immigrants | Grenada | 23.1 /100 | #196 | Fair 2.2% |
| Ghanaians | 21.8 /100 | #197 | Fair 2.2% |
| Czechoslovakians | 21.6 /100 | #198 | Fair 2.2% |
| Immigrants | El Salvador | 21.0 /100 | #199 | Fair 2.2% |
Demographics Similar to Swedes by Vision Disability
In terms of vision disability, the demographic groups most similar to Swedes are Danish (2.1%, a difference of 0.010%), Korean (2.1%, a difference of 0.030%), Carpatho Rusyn (2.1%, a difference of 0.040%), Chilean (2.1%, a difference of 0.050%), and Immigrants from Italy (2.1%, a difference of 0.060%).
| Demographics | Rating | Rank | Vision Disability |
| Estonians | 95.3 /100 | #99 | Exceptional 2.1% |
| Greeks | 95.1 /100 | #100 | Exceptional 2.1% |
| Albanians | 94.9 /100 | #101 | Exceptional 2.1% |
| Sri Lankans | 94.8 /100 | #102 | Exceptional 2.1% |
| Immigrants | Austria | 94.4 /100 | #103 | Exceptional 2.1% |
| Immigrants | Italy | 94.4 /100 | #104 | Exceptional 2.1% |
| Carpatho Rusyns | 94.3 /100 | #105 | Exceptional 2.1% |
| Swedes | 94.2 /100 | #106 | Exceptional 2.1% |
| Danes | 94.2 /100 | #107 | Exceptional 2.1% |
| Koreans | 94.1 /100 | #108 | Exceptional 2.1% |
| Chileans | 94.0 /100 | #109 | Exceptional 2.1% |
| Immigrants | Armenia | 93.8 /100 | #110 | Exceptional 2.1% |
| Peruvians | 93.5 /100 | #111 | Exceptional 2.1% |
| Immigrants | Denmark | 92.9 /100 | #112 | Exceptional 2.1% |
| Kenyans | 92.5 /100 | #113 | Exceptional 2.1% |