Peruvian vs Cambodian Cognitive Disability
COMPARE
Peruvian
Cambodian
Cognitive Disability
Cognitive Disability Comparison
Peruvians
Cambodians
16.7%
COGNITIVE DISABILITY
99.3/ 100
METRIC RATING
78th/ 347
METRIC RANK
17.3%
COGNITIVE DISABILITY
35.9/ 100
METRIC RATING
186th/ 347
METRIC RANK
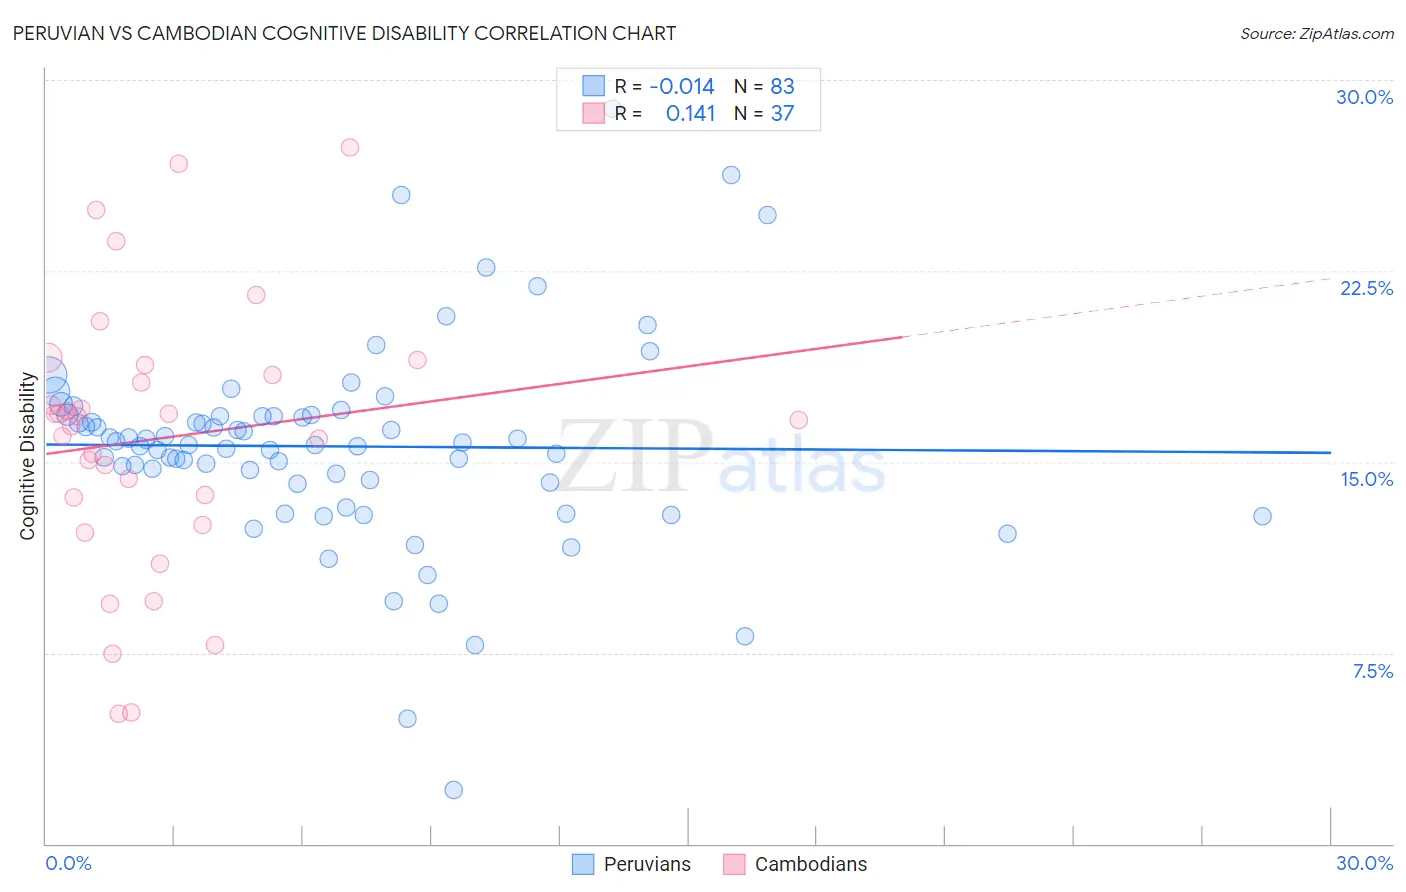
Peruvian vs Cambodian Cognitive Disability Correlation Chart
The statistical analysis conducted on geographies consisting of 363,189,902 people shows no correlation between the proportion of Peruvians and percentage of population with cognitive disability in the United States with a correlation coefficient (R) of -0.014 and weighted average of 16.7%. Similarly, the statistical analysis conducted on geographies consisting of 102,506,986 people shows a poor positive correlation between the proportion of Cambodians and percentage of population with cognitive disability in the United States with a correlation coefficient (R) of 0.141 and weighted average of 17.3%, a difference of 4.1%.
Cognitive Disability Correlation Summary
| Measurement | Peruvian | Cambodian |
| Minimum | 2.1% | 5.1% |
| Maximum | 28.9% | 27.4% |
| Range | 26.8% | 22.2% |
| Mean | 15.6% | 15.9% |
| Median | 15.7% | 16.7% |
| Interquartile 25% (IQ1) | 14.2% | 13.1% |
| Interquartile 75% (IQ3) | 16.8% | 18.6% |
| Interquartile Range (IQR) | 2.6% | 5.5% |
| Standard Deviation (Sample) | 4.0% | 5.3% |
| Standard Deviation (Population) | 4.0% | 5.2% |
Similar Demographics by Cognitive Disability
Demographics Similar to Peruvians by Cognitive Disability
In terms of cognitive disability, the demographic groups most similar to Peruvians are Immigrants from Hungary (16.7%, a difference of 0.0%), Immigrants from Serbia (16.7%, a difference of 0.010%), Immigrants from Bulgaria (16.7%, a difference of 0.010%), Estonian (16.7%, a difference of 0.030%), and Egyptian (16.7%, a difference of 0.030%).
| Demographics | Rating | Rank | Cognitive Disability |
| Immigrants | Belgium | 99.3 /100 | #71 | Exceptional 16.7% |
| Germans | 99.3 /100 | #72 | Exceptional 16.7% |
| Burmese | 99.3 /100 | #73 | Exceptional 16.7% |
| Slavs | 99.3 /100 | #74 | Exceptional 16.7% |
| Estonians | 99.3 /100 | #75 | Exceptional 16.7% |
| Immigrants | Serbia | 99.3 /100 | #76 | Exceptional 16.7% |
| Immigrants | Hungary | 99.3 /100 | #77 | Exceptional 16.7% |
| Peruvians | 99.3 /100 | #78 | Exceptional 16.7% |
| Immigrants | Bulgaria | 99.3 /100 | #79 | Exceptional 16.7% |
| Egyptians | 99.2 /100 | #80 | Exceptional 16.7% |
| Immigrants | Netherlands | 99.2 /100 | #81 | Exceptional 16.7% |
| Swiss | 99.2 /100 | #82 | Exceptional 16.7% |
| Serbians | 99.1 /100 | #83 | Exceptional 16.7% |
| Belgians | 99.1 /100 | #84 | Exceptional 16.7% |
| Immigrants | Moldova | 99.1 /100 | #85 | Exceptional 16.7% |
Demographics Similar to Cambodians by Cognitive Disability
In terms of cognitive disability, the demographic groups most similar to Cambodians are Afghan (17.3%, a difference of 0.070%), Immigrants from Fiji (17.4%, a difference of 0.070%), Crow (17.3%, a difference of 0.10%), Spaniard (17.3%, a difference of 0.13%), and Immigrants from France (17.4%, a difference of 0.20%).
| Demographics | Rating | Rank | Cognitive Disability |
| Sioux | 48.6 /100 | #179 | Average 17.3% |
| Pakistanis | 43.9 /100 | #180 | Average 17.3% |
| Immigrants | Guyana | 42.9 /100 | #181 | Average 17.3% |
| Arabs | 42.8 /100 | #182 | Average 17.3% |
| Spaniards | 40.3 /100 | #183 | Average 17.3% |
| Crow | 39.1 /100 | #184 | Fair 17.3% |
| Afghans | 38.2 /100 | #185 | Fair 17.3% |
| Cambodians | 35.9 /100 | #186 | Fair 17.3% |
| Immigrants | Fiji | 33.7 /100 | #187 | Fair 17.4% |
| Immigrants | France | 29.8 /100 | #188 | Fair 17.4% |
| Immigrants | Western Asia | 29.5 /100 | #189 | Fair 17.4% |
| Immigrants | Spain | 27.7 /100 | #190 | Fair 17.4% |
| Immigrants | Nonimmigrants | 27.4 /100 | #191 | Fair 17.4% |
| Immigrants | Haiti | 27.1 /100 | #192 | Fair 17.4% |
| Delaware | 25.6 /100 | #193 | Fair 17.4% |