Paraguayan vs Immigrants from Indonesia Disability Age Over 75
COMPARE
Paraguayan
Immigrants from Indonesia
Disability Age Over 75
Disability Age Over 75 Comparison
Paraguayans
Immigrants from Indonesia
45.0%
DISABILITY AGE OVER 75
100.0/ 100
METRIC RATING
9th/ 347
METRIC RANK
47.8%
DISABILITY AGE OVER 75
14.2/ 100
METRIC RATING
209th/ 347
METRIC RANK
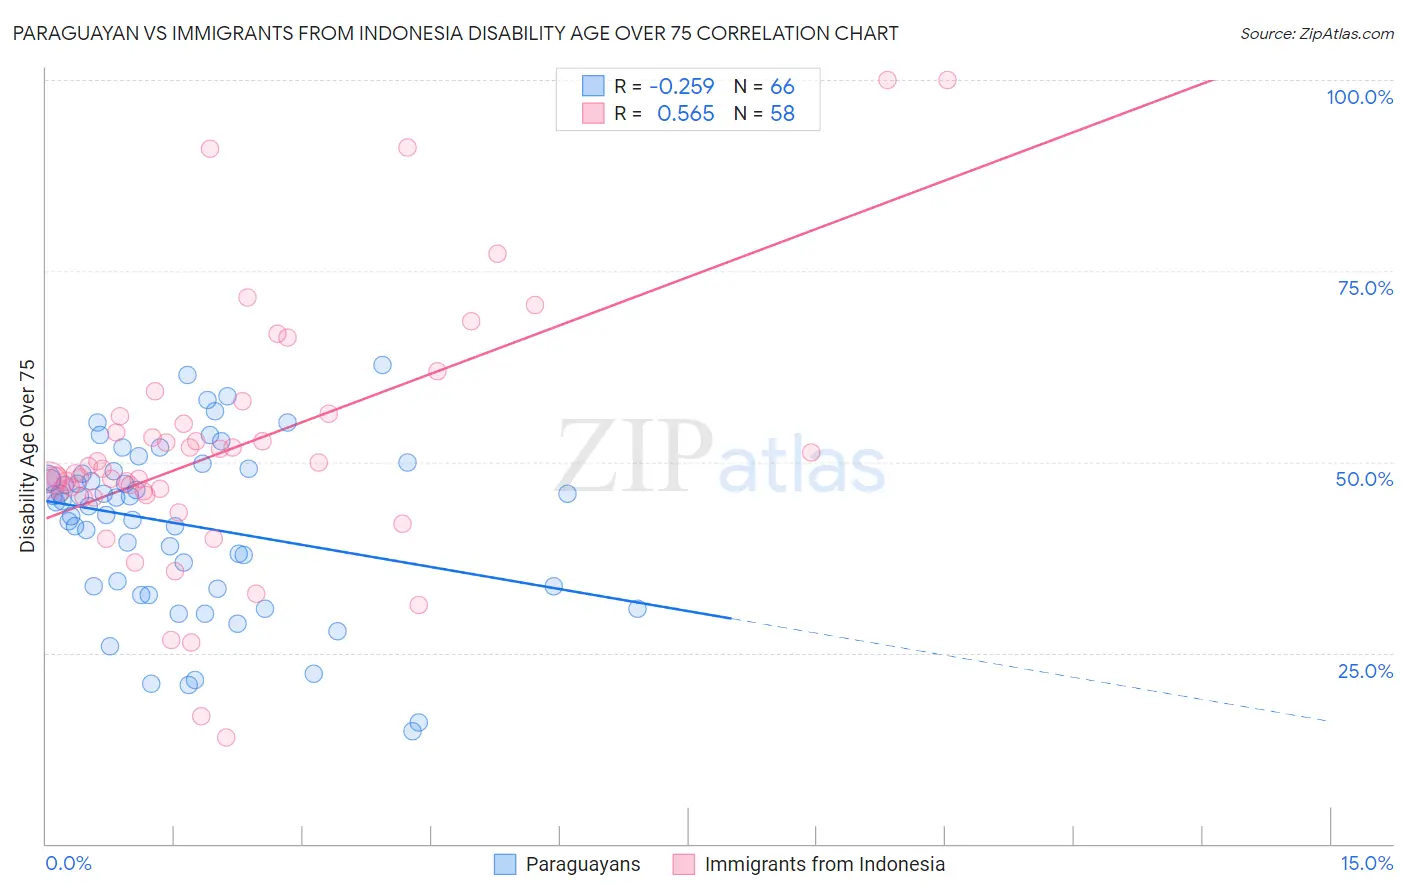
Paraguayan vs Immigrants from Indonesia Disability Age Over 75 Correlation Chart
The statistical analysis conducted on geographies consisting of 95,066,905 people shows a weak negative correlation between the proportion of Paraguayans and percentage of population with a disability over the age of 75 in the United States with a correlation coefficient (R) of -0.259 and weighted average of 45.0%. Similarly, the statistical analysis conducted on geographies consisting of 215,623,970 people shows a substantial positive correlation between the proportion of Immigrants from Indonesia and percentage of population with a disability over the age of 75 in the United States with a correlation coefficient (R) of 0.565 and weighted average of 47.8%, a difference of 6.3%.
Disability Age Over 75 Correlation Summary
| Measurement | Paraguayan | Immigrants from Indonesia |
| Minimum | 14.7% | 13.9% |
| Maximum | 62.7% | 100.0% |
| Range | 48.0% | 86.1% |
| Mean | 41.8% | 51.8% |
| Median | 44.8% | 48.8% |
| Interquartile 25% (IQ1) | 33.7% | 45.7% |
| Interquartile 75% (IQ3) | 48.8% | 56.0% |
| Interquartile Range (IQR) | 15.1% | 10.3% |
| Standard Deviation (Sample) | 11.1% | 16.9% |
| Standard Deviation (Population) | 11.0% | 16.7% |
Similar Demographics by Disability Age Over 75
Demographics Similar to Paraguayans by Disability Age Over 75
In terms of disability age over 75, the demographic groups most similar to Paraguayans are Immigrants from Austria (44.9%, a difference of 0.080%), Bulgarian (45.1%, a difference of 0.16%), Okinawan (44.9%, a difference of 0.20%), Lithuanian (45.1%, a difference of 0.21%), and Immigrants from Lithuania (44.9%, a difference of 0.24%).
| Demographics | Rating | Rank | Disability Age Over 75 |
| Immigrants | Ireland | 100.0 /100 | #2 | Exceptional 44.7% |
| Eastern Europeans | 100.0 /100 | #3 | Exceptional 44.8% |
| Carpatho Rusyns | 100.0 /100 | #4 | Exceptional 44.8% |
| Luxembourgers | 100.0 /100 | #5 | Exceptional 44.8% |
| Immigrants | Lithuania | 100.0 /100 | #6 | Exceptional 44.9% |
| Okinawans | 100.0 /100 | #7 | Exceptional 44.9% |
| Immigrants | Austria | 100.0 /100 | #8 | Exceptional 44.9% |
| Paraguayans | 100.0 /100 | #9 | Exceptional 45.0% |
| Bulgarians | 100.0 /100 | #10 | Exceptional 45.1% |
| Lithuanians | 100.0 /100 | #11 | Exceptional 45.1% |
| Immigrants | Czechoslovakia | 100.0 /100 | #12 | Exceptional 45.1% |
| Latvians | 100.0 /100 | #13 | Exceptional 45.1% |
| Immigrants | Scotland | 100.0 /100 | #14 | Exceptional 45.1% |
| Immigrants | Sweden | 100.0 /100 | #15 | Exceptional 45.1% |
| Immigrants | Northern Europe | 100.0 /100 | #16 | Exceptional 45.2% |
Demographics Similar to Immigrants from Indonesia by Disability Age Over 75
In terms of disability age over 75, the demographic groups most similar to Immigrants from Indonesia are Immigrants from Senegal (47.8%, a difference of 0.11%), Vietnamese (47.9%, a difference of 0.11%), Panamanian (47.9%, a difference of 0.12%), Immigrants from Burma/Myanmar (47.9%, a difference of 0.12%), and Immigrants from Syria (47.8%, a difference of 0.13%).
| Demographics | Rating | Rank | Disability Age Over 75 |
| Immigrants | Bahamas | 20.7 /100 | #202 | Fair 47.7% |
| Trinidadians and Tobagonians | 20.0 /100 | #203 | Fair 47.7% |
| Nigerians | 19.2 /100 | #204 | Poor 47.7% |
| Immigrants | Ghana | 19.1 /100 | #205 | Poor 47.7% |
| Jamaicans | 19.0 /100 | #206 | Poor 47.7% |
| Immigrants | Syria | 17.4 /100 | #207 | Poor 47.8% |
| Immigrants | Senegal | 16.9 /100 | #208 | Poor 47.8% |
| Immigrants | Indonesia | 14.2 /100 | #209 | Poor 47.8% |
| Vietnamese | 11.9 /100 | #210 | Poor 47.9% |
| Panamanians | 11.8 /100 | #211 | Poor 47.9% |
| Immigrants | Burma/Myanmar | 11.7 /100 | #212 | Poor 47.9% |
| Laotians | 11.5 /100 | #213 | Poor 47.9% |
| Immigrants | Barbados | 10.7 /100 | #214 | Poor 47.9% |
| Senegalese | 10.7 /100 | #215 | Poor 47.9% |
| Immigrants | Panama | 10.2 /100 | #216 | Poor 47.9% |