Paraguayan vs Immigrants from Moldova Female Disability
COMPARE
Paraguayan
Immigrants from Moldova
Female Disability
Female Disability Comparison
Paraguayans
Immigrants from Moldova
11.2%
FEMALE DISABILITY
100.0/ 100
METRIC RATING
41st/ 347
METRIC RANK
12.0%
FEMALE DISABILITY
81.4/ 100
METRIC RATING
150th/ 347
METRIC RANK
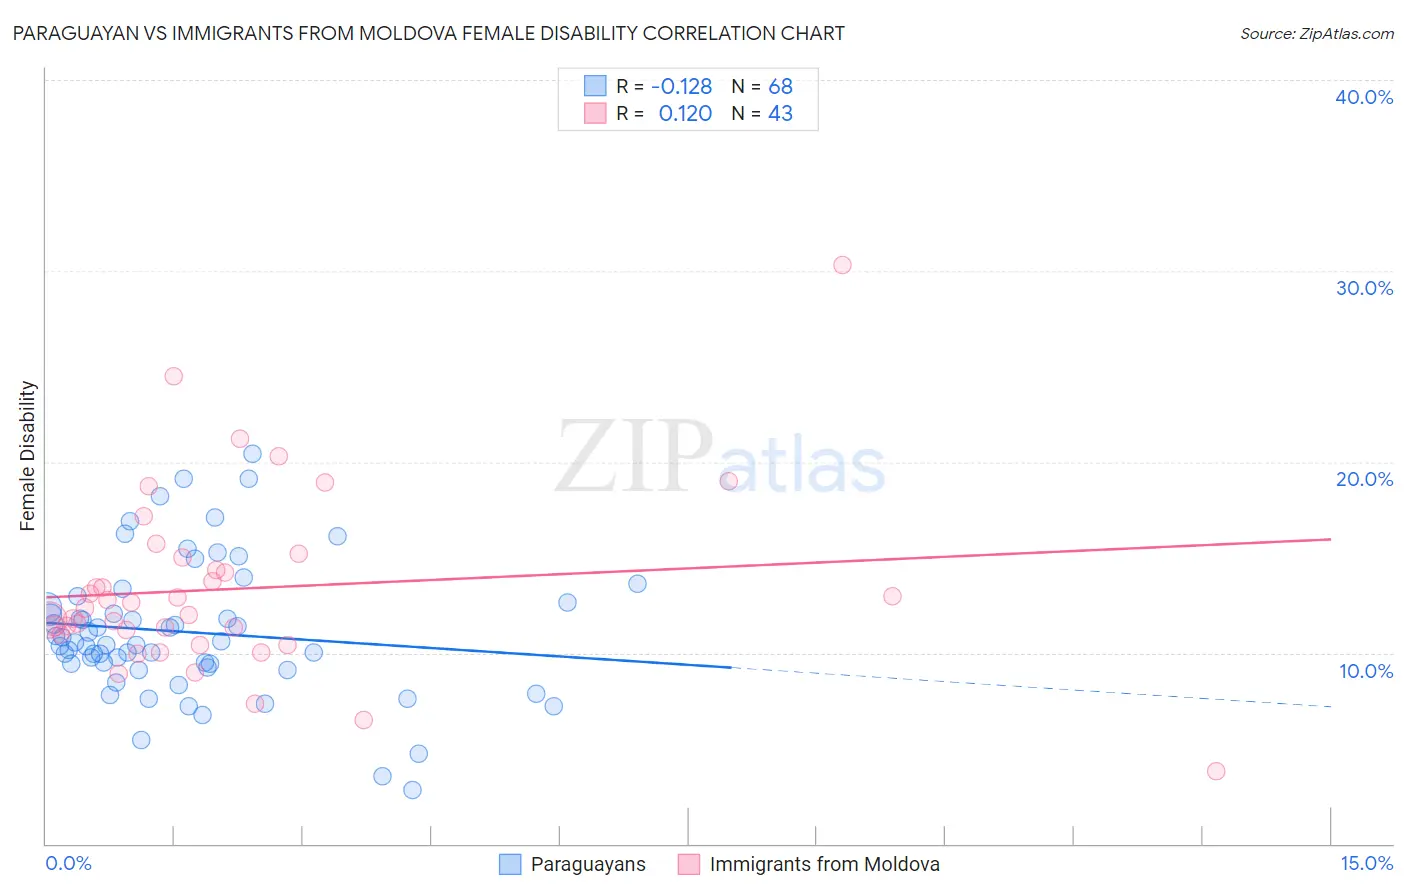
Paraguayan vs Immigrants from Moldova Female Disability Correlation Chart
The statistical analysis conducted on geographies consisting of 95,112,364 people shows a poor negative correlation between the proportion of Paraguayans and percentage of females with a disability in the United States with a correlation coefficient (R) of -0.128 and weighted average of 11.2%. Similarly, the statistical analysis conducted on geographies consisting of 124,376,042 people shows a poor positive correlation between the proportion of Immigrants from Moldova and percentage of females with a disability in the United States with a correlation coefficient (R) of 0.120 and weighted average of 12.0%, a difference of 7.1%.
Female Disability Correlation Summary
| Measurement | Paraguayan | Immigrants from Moldova |
| Minimum | 2.8% | 3.8% |
| Maximum | 20.4% | 30.3% |
| Range | 17.6% | 26.5% |
| Mean | 11.1% | 13.4% |
| Median | 10.5% | 12.3% |
| Interquartile 25% (IQ1) | 9.3% | 11.0% |
| Interquartile 75% (IQ3) | 12.5% | 15.0% |
| Interquartile Range (IQR) | 3.2% | 4.0% |
| Standard Deviation (Sample) | 3.5% | 4.7% |
| Standard Deviation (Population) | 3.5% | 4.7% |
Similar Demographics by Female Disability
Demographics Similar to Paraguayans by Female Disability
In terms of female disability, the demographic groups most similar to Paraguayans are Mongolian (11.2%, a difference of 0.020%), Immigrants from Lithuania (11.2%, a difference of 0.050%), Israeli (11.2%, a difference of 0.10%), Afghan (11.2%, a difference of 0.12%), and Immigrants from Ethiopia (11.2%, a difference of 0.26%).
| Demographics | Rating | Rank | Female Disability |
| Immigrants | Indonesia | 100.0 /100 | #34 | Exceptional 11.2% |
| Immigrants | Japan | 100.0 /100 | #35 | Exceptional 11.2% |
| Cypriots | 100.0 /100 | #36 | Exceptional 11.2% |
| Ethiopians | 100.0 /100 | #37 | Exceptional 11.2% |
| Immigrants | Ethiopia | 100.0 /100 | #38 | Exceptional 11.2% |
| Immigrants | Lithuania | 100.0 /100 | #39 | Exceptional 11.2% |
| Mongolians | 100.0 /100 | #40 | Exceptional 11.2% |
| Paraguayans | 100.0 /100 | #41 | Exceptional 11.2% |
| Israelis | 100.0 /100 | #42 | Exceptional 11.2% |
| Afghans | 100.0 /100 | #43 | Exceptional 11.2% |
| Cambodians | 100.0 /100 | #44 | Exceptional 11.3% |
| Immigrants | Sweden | 100.0 /100 | #45 | Exceptional 11.3% |
| Immigrants | Nepal | 100.0 /100 | #46 | Exceptional 11.3% |
| Jordanians | 100.0 /100 | #47 | Exceptional 11.3% |
| Zimbabweans | 100.0 /100 | #48 | Exceptional 11.3% |
Demographics Similar to Immigrants from Moldova by Female Disability
In terms of female disability, the demographic groups most similar to Immigrants from Moldova are Greek (12.0%, a difference of 0.030%), Icelander (12.0%, a difference of 0.040%), Immigrants from Kenya (12.0%, a difference of 0.11%), Immigrants from Scotland (12.0%, a difference of 0.13%), and Sudanese (12.0%, a difference of 0.14%).
| Demographics | Rating | Rank | Female Disability |
| Immigrants | Sudan | 89.6 /100 | #143 | Excellent 11.9% |
| Immigrants | Austria | 87.9 /100 | #144 | Excellent 12.0% |
| Estonians | 87.8 /100 | #145 | Excellent 12.0% |
| Pakistanis | 84.6 /100 | #146 | Excellent 12.0% |
| Nigerians | 84.0 /100 | #147 | Excellent 12.0% |
| Immigrants | Kenya | 83.1 /100 | #148 | Excellent 12.0% |
| Greeks | 82.0 /100 | #149 | Excellent 12.0% |
| Immigrants | Moldova | 81.4 /100 | #150 | Excellent 12.0% |
| Icelanders | 80.7 /100 | #151 | Excellent 12.0% |
| Immigrants | Scotland | 79.3 /100 | #152 | Good 12.0% |
| Sudanese | 79.1 /100 | #153 | Good 12.0% |
| Syrians | 76.9 /100 | #154 | Good 12.1% |
| Ghanaians | 76.6 /100 | #155 | Good 12.1% |
| Moroccans | 72.9 /100 | #156 | Good 12.1% |
| Danes | 72.5 /100 | #157 | Good 12.1% |