Palestinian vs Puerto Rican Vision Disability
COMPARE
Palestinian
Puerto Rican
Vision Disability
Vision Disability Comparison
Palestinians
Puerto Ricans
2.0%
VISION DISABILITY
98.3/ 100
METRIC RATING
74th/ 347
METRIC RANK
3.9%
VISION DISABILITY
0.0/ 100
METRIC RATING
347th/ 347
METRIC RANK
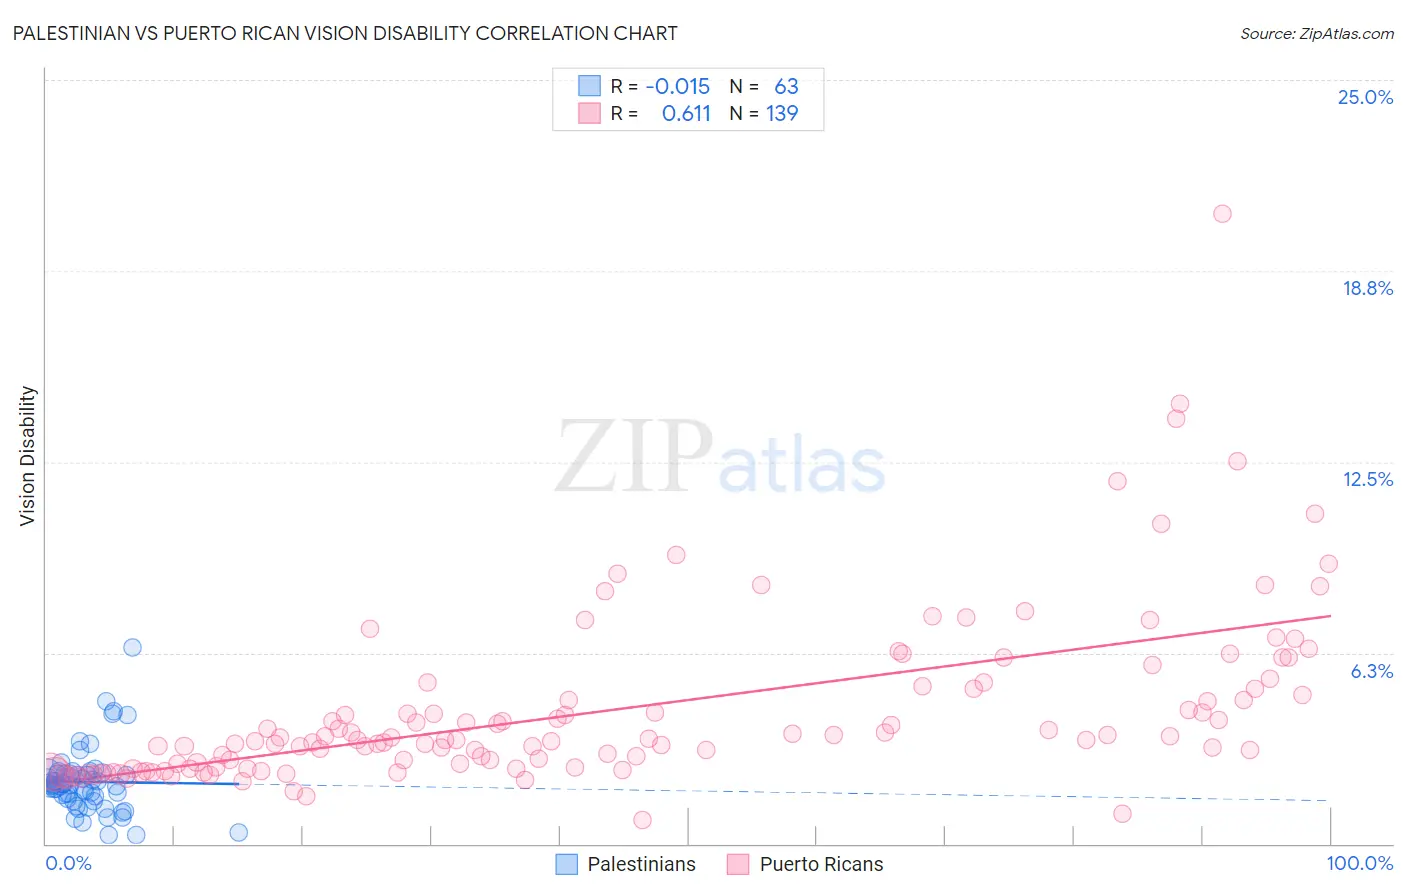
Palestinian vs Puerto Rican Vision Disability Correlation Chart
The statistical analysis conducted on geographies consisting of 216,427,848 people shows no correlation between the proportion of Palestinians and percentage of population with vision disability in the United States with a correlation coefficient (R) of -0.015 and weighted average of 2.0%. Similarly, the statistical analysis conducted on geographies consisting of 527,298,658 people shows a significant positive correlation between the proportion of Puerto Ricans and percentage of population with vision disability in the United States with a correlation coefficient (R) of 0.611 and weighted average of 3.9%, a difference of 91.2%.
Vision Disability Correlation Summary
| Measurement | Palestinian | Puerto Rican |
| Minimum | 0.30% | 0.78% |
| Maximum | 6.4% | 20.6% |
| Range | 6.1% | 19.8% |
| Mean | 2.0% | 4.4% |
| Median | 1.9% | 3.4% |
| Interquartile 25% (IQ1) | 1.5% | 2.5% |
| Interquartile 75% (IQ3) | 2.3% | 5.1% |
| Interquartile Range (IQR) | 0.81% | 2.6% |
| Standard Deviation (Sample) | 1.1% | 2.9% |
| Standard Deviation (Population) | 1.1% | 2.9% |
Similar Demographics by Vision Disability
Demographics Similar to Palestinians by Vision Disability
In terms of vision disability, the demographic groups most similar to Palestinians are Immigrants from North Macedonia (2.0%, a difference of 0.0%), Paraguayan (2.0%, a difference of 0.020%), Immigrants from Jordan (2.0%, a difference of 0.020%), Immigrants from Eritrea (2.0%, a difference of 0.050%), and Immigrants from Eastern Europe (2.0%, a difference of 0.050%).
| Demographics | Rating | Rank | Vision Disability |
| Immigrants | Northern Africa | 98.8 /100 | #67 | Exceptional 2.0% |
| Immigrants | Czechoslovakia | 98.7 /100 | #68 | Exceptional 2.0% |
| Russians | 98.6 /100 | #69 | Exceptional 2.0% |
| Immigrants | Kazakhstan | 98.6 /100 | #70 | Exceptional 2.0% |
| Immigrants | Northern Europe | 98.6 /100 | #71 | Exceptional 2.0% |
| Immigrants | France | 98.5 /100 | #72 | Exceptional 2.0% |
| Immigrants | Eritrea | 98.4 /100 | #73 | Exceptional 2.0% |
| Palestinians | 98.3 /100 | #74 | Exceptional 2.0% |
| Immigrants | North Macedonia | 98.3 /100 | #75 | Exceptional 2.0% |
| Paraguayans | 98.3 /100 | #76 | Exceptional 2.0% |
| Immigrants | Jordan | 98.3 /100 | #77 | Exceptional 2.0% |
| Immigrants | Eastern Europe | 98.3 /100 | #78 | Exceptional 2.0% |
| Assyrians/Chaldeans/Syriacs | 98.1 /100 | #79 | Exceptional 2.0% |
| Lithuanians | 97.7 /100 | #80 | Exceptional 2.0% |
| Soviet Union | 97.6 /100 | #81 | Exceptional 2.0% |
Demographics Similar to Puerto Ricans by Vision Disability
In terms of vision disability, the demographic groups most similar to Puerto Ricans are Houma (3.4%, a difference of 12.7%), Lumbee (3.4%, a difference of 14.5%), Pueblo (3.3%, a difference of 16.4%), Pima (3.3%, a difference of 16.4%), and Choctaw (3.3%, a difference of 17.6%).
| Demographics | Rating | Rank | Vision Disability |
| Cajuns | 0.0 /100 | #333 | Tragic 3.1% |
| Cheyenne | 0.0 /100 | #334 | Tragic 3.1% |
| Navajo | 0.0 /100 | #335 | Tragic 3.1% |
| Alaskan Athabascans | 0.0 /100 | #336 | Tragic 3.1% |
| Dutch West Indians | 0.0 /100 | #337 | Tragic 3.2% |
| Chickasaw | 0.0 /100 | #338 | Tragic 3.2% |
| Tsimshian | 0.0 /100 | #339 | Tragic 3.2% |
| Creek | 0.0 /100 | #340 | Tragic 3.2% |
| Kiowa | 0.0 /100 | #341 | Tragic 3.3% |
| Choctaw | 0.0 /100 | #342 | Tragic 3.3% |
| Pima | 0.0 /100 | #343 | Tragic 3.3% |
| Pueblo | 0.0 /100 | #344 | Tragic 3.3% |
| Lumbee | 0.0 /100 | #345 | Tragic 3.4% |
| Houma | 0.0 /100 | #346 | Tragic 3.4% |
| Puerto Ricans | 0.0 /100 | #347 | Tragic 3.9% |