Pakistani vs Moroccan Disability Age Under 5
COMPARE
Pakistani
Moroccan
Disability Age Under 5
Disability Age Under 5 Comparison
Pakistanis
Moroccans
1.3%
DISABILITY AGE UNDER 5
19.4/ 100
METRIC RATING
210th/ 347
METRIC RANK
1.2%
DISABILITY AGE UNDER 5
83.6/ 100
METRIC RATING
136th/ 347
METRIC RANK
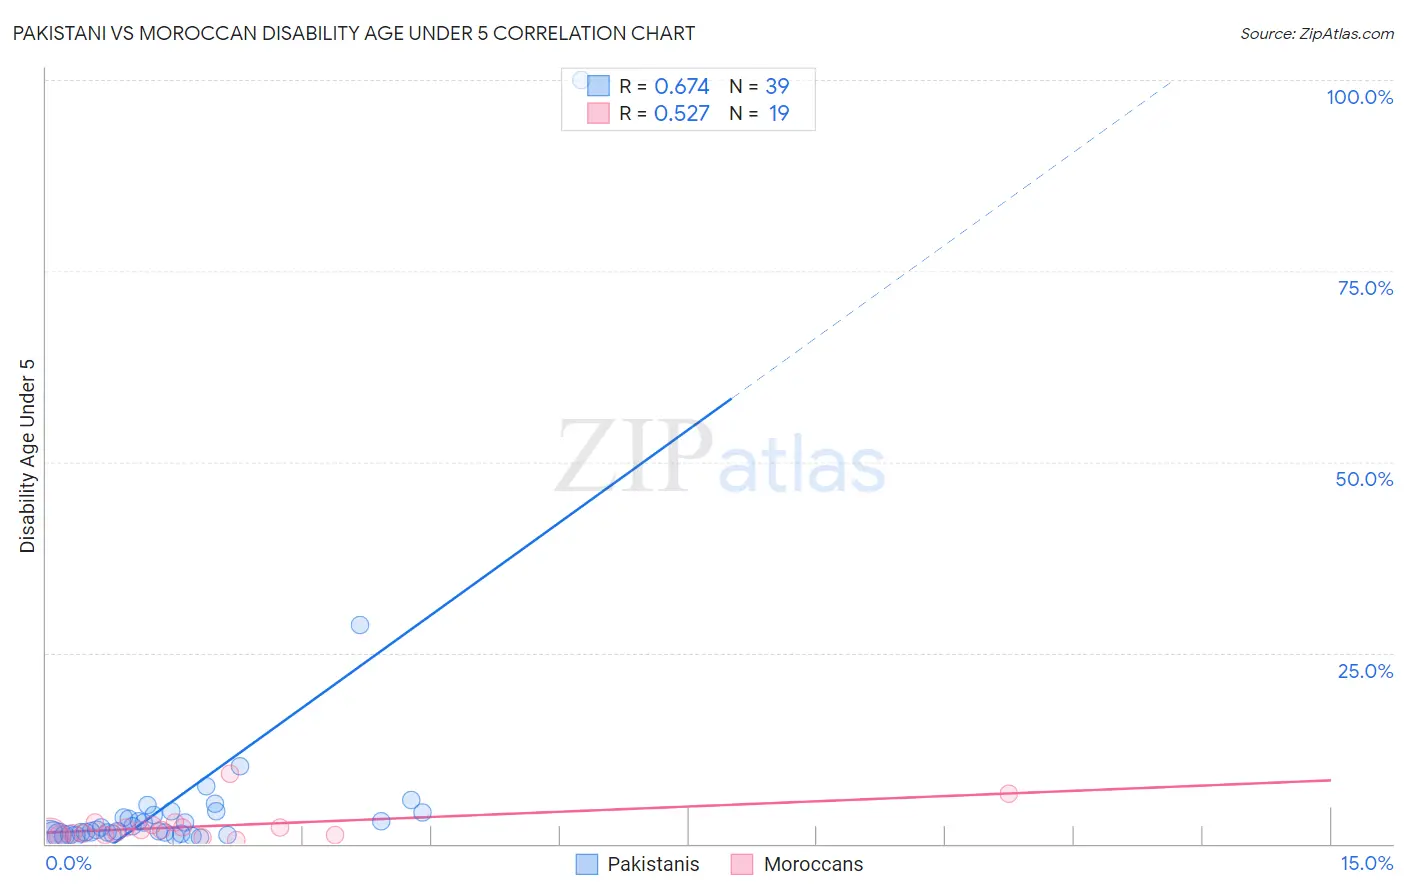
Pakistani vs Moroccan Disability Age Under 5 Correlation Chart
The statistical analysis conducted on geographies consisting of 195,172,066 people shows a significant positive correlation between the proportion of Pakistanis and percentage of population with a disability under the age of 5 in the United States with a correlation coefficient (R) of 0.674 and weighted average of 1.3%. Similarly, the statistical analysis conducted on geographies consisting of 132,015,425 people shows a substantial positive correlation between the proportion of Moroccans and percentage of population with a disability under the age of 5 in the United States with a correlation coefficient (R) of 0.527 and weighted average of 1.2%, a difference of 7.2%.
Disability Age Under 5 Correlation Summary
| Measurement | Pakistani | Moroccan |
| Minimum | 0.81% | 0.49% |
| Maximum | 100.0% | 9.2% |
| Range | 99.2% | 8.7% |
| Mean | 5.8% | 2.3% |
| Median | 1.8% | 1.8% |
| Interquartile 25% (IQ1) | 1.3% | 1.2% |
| Interquartile 75% (IQ3) | 4.1% | 2.4% |
| Interquartile Range (IQR) | 2.8% | 1.3% |
| Standard Deviation (Sample) | 16.2% | 2.1% |
| Standard Deviation (Population) | 15.9% | 2.1% |
Similar Demographics by Disability Age Under 5
Demographics Similar to Pakistanis by Disability Age Under 5
In terms of disability age under 5, the demographic groups most similar to Pakistanis are Bulgarian (1.3%, a difference of 0.010%), Immigrants from Greece (1.3%, a difference of 0.040%), Chilean (1.3%, a difference of 0.090%), Immigrants from Sudan (1.3%, a difference of 0.10%), and Mexican (1.3%, a difference of 0.19%).
| Demographics | Rating | Rank | Disability Age Under 5 |
| Liberians | 24.0 /100 | #203 | Fair 1.3% |
| Immigrants | Europe | 23.6 /100 | #204 | Fair 1.3% |
| Romanians | 22.5 /100 | #205 | Fair 1.3% |
| Immigrants | Poland | 22.4 /100 | #206 | Fair 1.3% |
| Nigerians | 21.2 /100 | #207 | Fair 1.3% |
| Mexicans | 20.8 /100 | #208 | Fair 1.3% |
| Bulgarians | 19.5 /100 | #209 | Poor 1.3% |
| Pakistanis | 19.4 /100 | #210 | Poor 1.3% |
| Immigrants | Greece | 19.1 /100 | #211 | Poor 1.3% |
| Chileans | 18.8 /100 | #212 | Poor 1.3% |
| Immigrants | Sudan | 18.7 /100 | #213 | Poor 1.3% |
| Immigrants | Chile | 17.2 /100 | #214 | Poor 1.3% |
| Syrians | 16.1 /100 | #215 | Poor 1.3% |
| Bangladeshis | 15.5 /100 | #216 | Poor 1.3% |
| Cypriots | 14.9 /100 | #217 | Poor 1.3% |
Demographics Similar to Moroccans by Disability Age Under 5
In terms of disability age under 5, the demographic groups most similar to Moroccans are Immigrants from Eastern Africa (1.2%, a difference of 0.090%), Immigrants from Czechoslovakia (1.2%, a difference of 0.14%), Fijian (1.2%, a difference of 0.18%), New Zealander (1.2%, a difference of 0.37%), and Argentinean (1.2%, a difference of 0.38%).
| Demographics | Rating | Rank | Disability Age Under 5 |
| Immigrants | Immigrants | 88.0 /100 | #129 | Excellent 1.2% |
| Koreans | 87.7 /100 | #130 | Excellent 1.2% |
| Immigrants | Serbia | 87.6 /100 | #131 | Excellent 1.2% |
| Immigrants | Eastern Europe | 87.3 /100 | #132 | Excellent 1.2% |
| Immigrants | Spain | 86.5 /100 | #133 | Excellent 1.2% |
| Argentineans | 85.7 /100 | #134 | Excellent 1.2% |
| Fijians | 84.7 /100 | #135 | Excellent 1.2% |
| Moroccans | 83.6 /100 | #136 | Excellent 1.2% |
| Immigrants | Eastern Africa | 83.1 /100 | #137 | Excellent 1.2% |
| Immigrants | Czechoslovakia | 82.8 /100 | #138 | Excellent 1.2% |
| New Zealanders | 81.4 /100 | #139 | Excellent 1.2% |
| Somalis | 80.8 /100 | #140 | Excellent 1.2% |
| Immigrants | Honduras | 80.4 /100 | #141 | Excellent 1.2% |
| Immigrants | Colombia | 79.3 /100 | #142 | Good 1.2% |
| Alsatians | 79.3 /100 | #143 | Good 1.2% |