Pakistani vs Honduran Disability Age Under 5
COMPARE
Pakistani
Honduran
Disability Age Under 5
Disability Age Under 5 Comparison
Pakistanis
Hondurans
1.3%
DISABILITY AGE UNDER 5
19.4/ 100
METRIC RATING
210th/ 347
METRIC RANK
1.2%
DISABILITY AGE UNDER 5
72.5/ 100
METRIC RATING
152nd/ 347
METRIC RANK
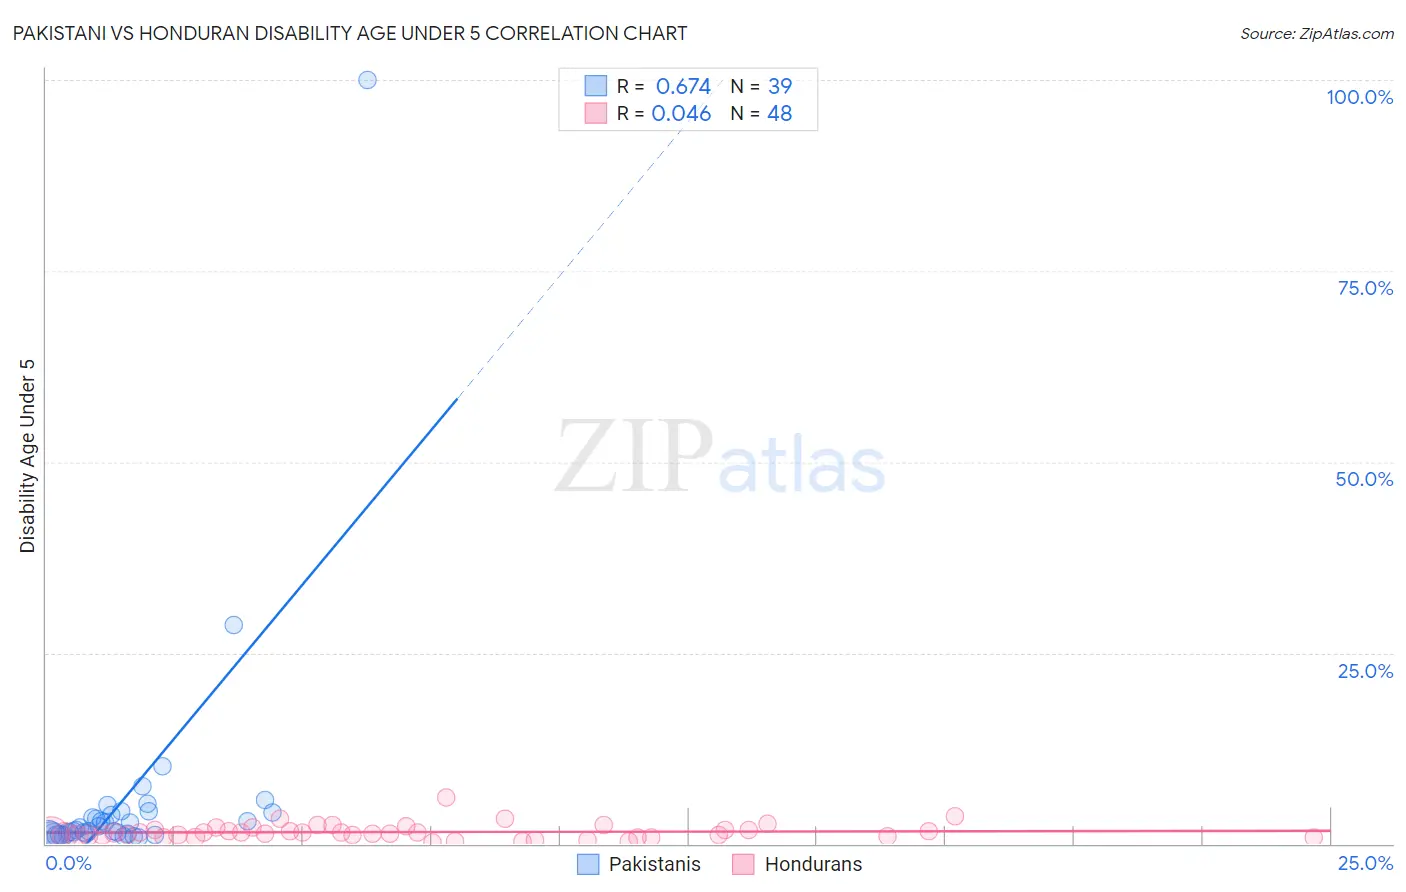
Pakistani vs Honduran Disability Age Under 5 Correlation Chart
The statistical analysis conducted on geographies consisting of 195,172,066 people shows a significant positive correlation between the proportion of Pakistanis and percentage of population with a disability under the age of 5 in the United States with a correlation coefficient (R) of 0.674 and weighted average of 1.3%. Similarly, the statistical analysis conducted on geographies consisting of 207,586,632 people shows no correlation between the proportion of Hondurans and percentage of population with a disability under the age of 5 in the United States with a correlation coefficient (R) of 0.046 and weighted average of 1.2%, a difference of 5.5%.
Disability Age Under 5 Correlation Summary
| Measurement | Pakistani | Honduran |
| Minimum | 0.81% | 0.16% |
| Maximum | 100.0% | 6.1% |
| Range | 99.2% | 6.0% |
| Mean | 5.8% | 1.5% |
| Median | 1.8% | 1.4% |
| Interquartile 25% (IQ1) | 1.3% | 0.96% |
| Interquartile 75% (IQ3) | 4.1% | 1.8% |
| Interquartile Range (IQR) | 2.8% | 0.86% |
| Standard Deviation (Sample) | 16.2% | 1.0% |
| Standard Deviation (Population) | 15.9% | 1.0% |
Similar Demographics by Disability Age Under 5
Demographics Similar to Pakistanis by Disability Age Under 5
In terms of disability age under 5, the demographic groups most similar to Pakistanis are Bulgarian (1.3%, a difference of 0.010%), Immigrants from Greece (1.3%, a difference of 0.040%), Chilean (1.3%, a difference of 0.090%), Immigrants from Sudan (1.3%, a difference of 0.10%), and Mexican (1.3%, a difference of 0.19%).
| Demographics | Rating | Rank | Disability Age Under 5 |
| Liberians | 24.0 /100 | #203 | Fair 1.3% |
| Immigrants | Europe | 23.6 /100 | #204 | Fair 1.3% |
| Romanians | 22.5 /100 | #205 | Fair 1.3% |
| Immigrants | Poland | 22.4 /100 | #206 | Fair 1.3% |
| Nigerians | 21.2 /100 | #207 | Fair 1.3% |
| Mexicans | 20.8 /100 | #208 | Fair 1.3% |
| Bulgarians | 19.5 /100 | #209 | Poor 1.3% |
| Pakistanis | 19.4 /100 | #210 | Poor 1.3% |
| Immigrants | Greece | 19.1 /100 | #211 | Poor 1.3% |
| Chileans | 18.8 /100 | #212 | Poor 1.3% |
| Immigrants | Sudan | 18.7 /100 | #213 | Poor 1.3% |
| Immigrants | Chile | 17.2 /100 | #214 | Poor 1.3% |
| Syrians | 16.1 /100 | #215 | Poor 1.3% |
| Bangladeshis | 15.5 /100 | #216 | Poor 1.3% |
| Cypriots | 14.9 /100 | #217 | Poor 1.3% |
Demographics Similar to Hondurans by Disability Age Under 5
In terms of disability age under 5, the demographic groups most similar to Hondurans are Yaqui (1.2%, a difference of 0.28%), Immigrants from Thailand (1.2%, a difference of 0.34%), South American (1.2%, a difference of 0.38%), Uruguayan (1.2%, a difference of 0.41%), and Kenyan (1.2%, a difference of 0.42%).
| Demographics | Rating | Rank | Disability Age Under 5 |
| Immigrants | Zimbabwe | 77.9 /100 | #145 | Good 1.2% |
| Samoans | 77.7 /100 | #146 | Good 1.2% |
| Icelanders | 76.3 /100 | #147 | Good 1.2% |
| Ghanaians | 76.3 /100 | #148 | Good 1.2% |
| Kenyans | 75.9 /100 | #149 | Good 1.2% |
| South Americans | 75.6 /100 | #150 | Good 1.2% |
| Yaqui | 74.8 /100 | #151 | Good 1.2% |
| Hondurans | 72.5 /100 | #152 | Good 1.2% |
| Immigrants | Thailand | 69.4 /100 | #153 | Good 1.2% |
| Uruguayans | 68.8 /100 | #154 | Good 1.2% |
| Immigrants | Ghana | 68.7 /100 | #155 | Good 1.2% |
| Hawaiians | 68.5 /100 | #156 | Good 1.2% |
| Immigrants | South America | 67.0 /100 | #157 | Good 1.2% |
| Arabs | 66.4 /100 | #158 | Good 1.2% |
| Colombians | 65.8 /100 | #159 | Good 1.2% |