Paiute vs Honduran Hearing Disability
COMPARE
Paiute
Honduran
Hearing Disability
Hearing Disability Comparison
Paiute
Hondurans
4.1%
HEARING DISABILITY
0.0/ 100
METRIC RATING
321st/ 347
METRIC RANK
2.8%
HEARING DISABILITY
93.4/ 100
METRIC RATING
106th/ 347
METRIC RANK
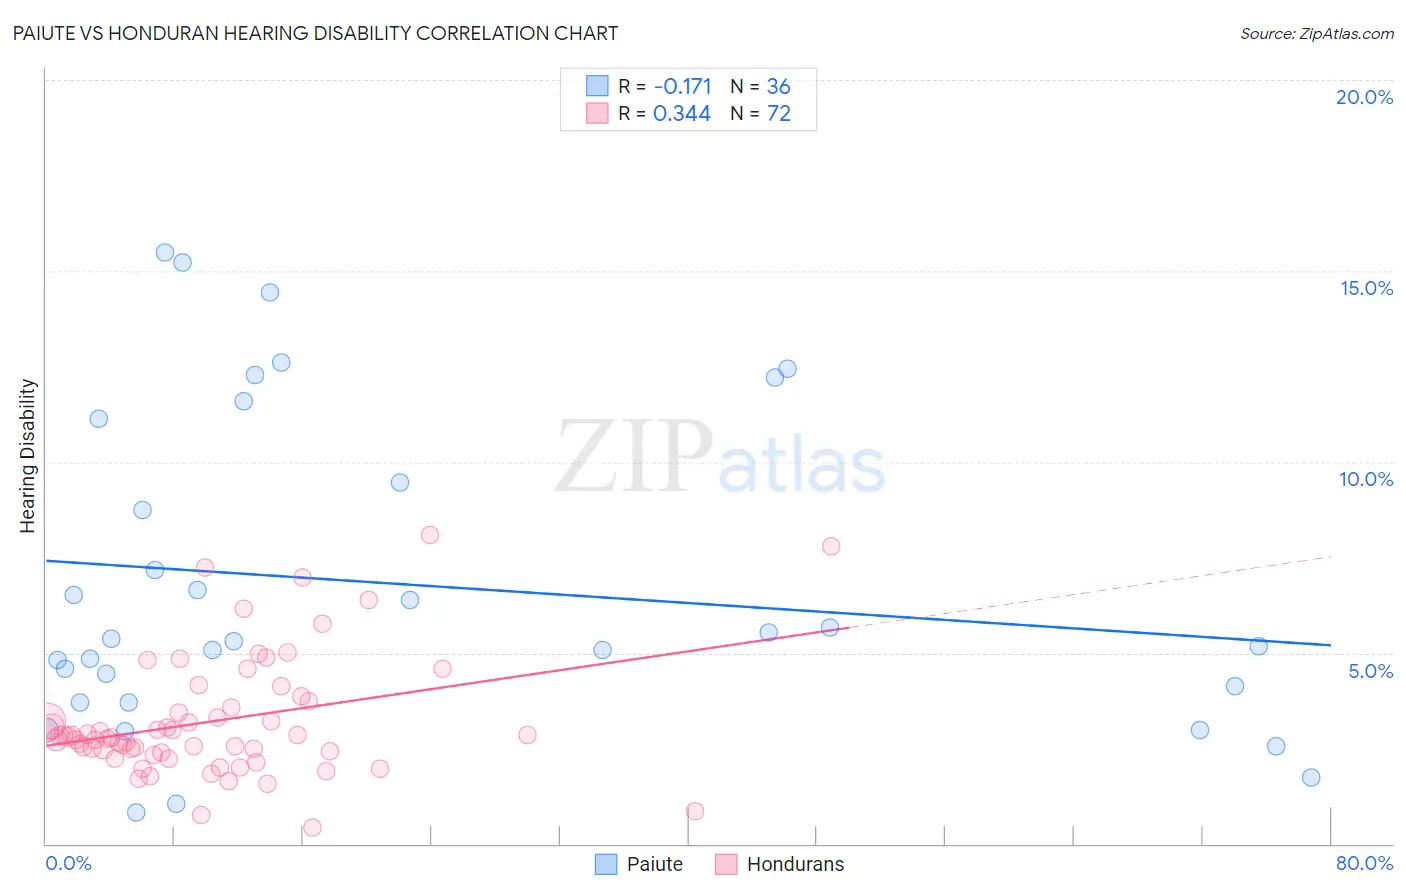
Paiute vs Honduran Hearing Disability Correlation Chart
The statistical analysis conducted on geographies consisting of 58,392,251 people shows a poor negative correlation between the proportion of Paiute and percentage of population with hearing disability in the United States with a correlation coefficient (R) of -0.171 and weighted average of 4.1%. Similarly, the statistical analysis conducted on geographies consisting of 357,671,786 people shows a mild positive correlation between the proportion of Hondurans and percentage of population with hearing disability in the United States with a correlation coefficient (R) of 0.344 and weighted average of 2.8%, a difference of 45.1%.
Hearing Disability Correlation Summary
| Measurement | Paiute | Honduran |
| Minimum | 0.82% | 0.44% |
| Maximum | 15.5% | 8.1% |
| Range | 14.7% | 7.6% |
| Mean | 6.8% | 3.2% |
| Median | 5.3% | 2.8% |
| Interquartile 25% (IQ1) | 3.9% | 2.4% |
| Interquartile 75% (IQ3) | 10.3% | 3.7% |
| Interquartile Range (IQR) | 6.4% | 1.2% |
| Standard Deviation (Sample) | 4.1% | 1.6% |
| Standard Deviation (Population) | 4.1% | 1.5% |
Similar Demographics by Hearing Disability
Demographics Similar to Paiute by Hearing Disability
In terms of hearing disability, the demographic groups most similar to Paiute are Seminole (4.1%, a difference of 0.26%), Apache (4.1%, a difference of 0.38%), Osage (4.1%, a difference of 0.45%), Lumbee (4.1%, a difference of 0.77%), and Potawatomi (4.1%, a difference of 1.1%).
| Demographics | Rating | Rank | Hearing Disability |
| Yakama | 0.0 /100 | #314 | Tragic 3.9% |
| Puget Sound Salish | 0.0 /100 | #315 | Tragic 3.9% |
| Spanish Americans | 0.0 /100 | #316 | Tragic 4.0% |
| Comanche | 0.0 /100 | #317 | Tragic 4.0% |
| Cheyenne | 0.0 /100 | #318 | Tragic 4.0% |
| Chippewa | 0.0 /100 | #319 | Tragic 4.0% |
| Shoshone | 0.0 /100 | #320 | Tragic 4.0% |
| Paiute | 0.0 /100 | #321 | Tragic 4.1% |
| Seminole | 0.0 /100 | #322 | Tragic 4.1% |
| Apache | 0.0 /100 | #323 | Tragic 4.1% |
| Osage | 0.0 /100 | #324 | Tragic 4.1% |
| Lumbee | 0.0 /100 | #325 | Tragic 4.1% |
| Potawatomi | 0.0 /100 | #326 | Tragic 4.1% |
| Arapaho | 0.0 /100 | #327 | Tragic 4.1% |
| Tohono O'odham | 0.0 /100 | #328 | Tragic 4.2% |
Demographics Similar to Hondurans by Hearing Disability
In terms of hearing disability, the demographic groups most similar to Hondurans are Immigrants from Chile (2.8%, a difference of 0.0%), Guatemalan (2.8%, a difference of 0.080%), Turkish (2.8%, a difference of 0.15%), Cypriot (2.8%, a difference of 0.20%), and Moroccan (2.8%, a difference of 0.24%).
| Demographics | Rating | Rank | Hearing Disability |
| Immigrants | Guatemala | 95.1 /100 | #99 | Exceptional 2.8% |
| Immigrants | Eastern Africa | 95.0 /100 | #100 | Exceptional 2.8% |
| Immigrants | Spain | 94.9 /100 | #101 | Exceptional 2.8% |
| Taiwanese | 94.8 /100 | #102 | Exceptional 2.8% |
| Immigrants | Indonesia | 94.7 /100 | #103 | Exceptional 2.8% |
| Burmese | 94.2 /100 | #104 | Exceptional 2.8% |
| Moroccans | 93.9 /100 | #105 | Exceptional 2.8% |
| Hondurans | 93.4 /100 | #106 | Exceptional 2.8% |
| Immigrants | Chile | 93.4 /100 | #107 | Exceptional 2.8% |
| Guatemalans | 93.2 /100 | #108 | Exceptional 2.8% |
| Turks | 93.0 /100 | #109 | Exceptional 2.8% |
| Cypriots | 92.9 /100 | #110 | Exceptional 2.8% |
| Immigrants | Yemen | 92.7 /100 | #111 | Exceptional 2.8% |
| U.S. Virgin Islanders | 92.5 /100 | #112 | Exceptional 2.8% |
| Immigrants | Belarus | 91.6 /100 | #113 | Exceptional 2.8% |