Paiute vs Cherokee Disability Age 5 to 17
COMPARE
Paiute
Cherokee
Disability Age 5 to 17
Disability Age 5 to 17 Comparison
Paiute
Cherokee
5.7%
DISABILITY AGE 5 TO 17
11.2/ 100
METRIC RATING
204th/ 347
METRIC RANK
6.9%
DISABILITY AGE 5 TO 17
0.0/ 100
METRIC RATING
340th/ 347
METRIC RANK
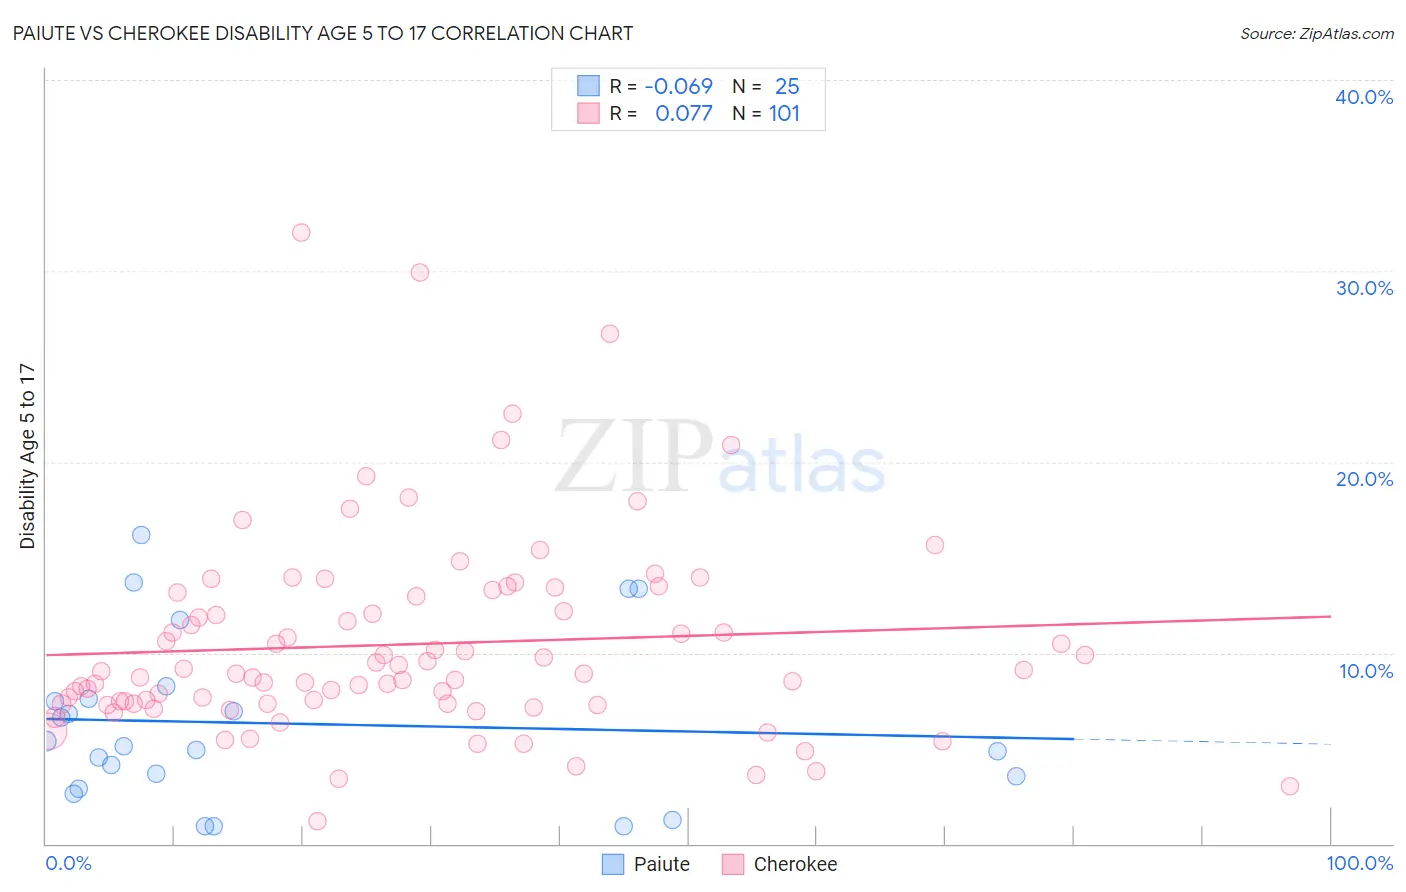
Paiute vs Cherokee Disability Age 5 to 17 Correlation Chart
The statistical analysis conducted on geographies consisting of 58,225,397 people shows a slight negative correlation between the proportion of Paiute and percentage of population with a disability between the ages 5 and 17 in the United States with a correlation coefficient (R) of -0.069 and weighted average of 5.7%. Similarly, the statistical analysis conducted on geographies consisting of 487,353,111 people shows a slight positive correlation between the proportion of Cherokee and percentage of population with a disability between the ages 5 and 17 in the United States with a correlation coefficient (R) of 0.077 and weighted average of 6.9%, a difference of 20.6%.
Disability Age 5 to 17 Correlation Summary
| Measurement | Paiute | Cherokee |
| Minimum | 0.89% | 1.2% |
| Maximum | 16.2% | 32.0% |
| Range | 15.3% | 30.8% |
| Mean | 6.3% | 10.4% |
| Median | 5.1% | 8.9% |
| Interquartile 25% (IQ1) | 3.2% | 7.3% |
| Interquartile 75% (IQ3) | 7.9% | 13.1% |
| Interquartile Range (IQR) | 4.7% | 5.8% |
| Standard Deviation (Sample) | 4.4% | 5.3% |
| Standard Deviation (Population) | 4.3% | 5.2% |
Similar Demographics by Disability Age 5 to 17
Demographics Similar to Paiute by Disability Age 5 to 17
In terms of disability age 5 to 17, the demographic groups most similar to Paiute are Trinidadian and Tobagonian (5.7%, a difference of 0.050%), Immigrants from Africa (5.7%, a difference of 0.060%), Moroccan (5.7%, a difference of 0.10%), Kenyan (5.8%, a difference of 0.15%), and Spanish American Indian (5.7%, a difference of 0.18%).
| Demographics | Rating | Rank | Disability Age 5 to 17 |
| Immigrants | North America | 23.1 /100 | #197 | Fair 5.7% |
| Norwegians | 20.9 /100 | #198 | Fair 5.7% |
| Northern Europeans | 15.2 /100 | #199 | Poor 5.7% |
| Icelanders | 14.6 /100 | #200 | Poor 5.7% |
| Basques | 13.7 /100 | #201 | Poor 5.7% |
| Austrians | 13.2 /100 | #202 | Poor 5.7% |
| Spanish American Indians | 12.8 /100 | #203 | Poor 5.7% |
| Paiute | 11.2 /100 | #204 | Poor 5.7% |
| Trinidadians and Tobagonians | 10.8 /100 | #205 | Poor 5.7% |
| Immigrants | Africa | 10.8 /100 | #206 | Poor 5.7% |
| Moroccans | 10.4 /100 | #207 | Poor 5.7% |
| Kenyans | 10.0 /100 | #208 | Poor 5.8% |
| Immigrants | Uganda | 9.7 /100 | #209 | Tragic 5.8% |
| Immigrants | Haiti | 9.5 /100 | #210 | Tragic 5.8% |
| Yugoslavians | 9.1 /100 | #211 | Tragic 5.8% |
Demographics Similar to Cherokee by Disability Age 5 to 17
In terms of disability age 5 to 17, the demographic groups most similar to Cherokee are Choctaw (6.9%, a difference of 0.26%), Cape Verdean (7.0%, a difference of 0.54%), Iroquois (6.9%, a difference of 0.59%), Creek (6.9%, a difference of 0.83%), and Chickasaw (6.8%, a difference of 1.3%).
| Demographics | Rating | Rank | Disability Age 5 to 17 |
| Blacks/African Americans | 0.0 /100 | #333 | Tragic 6.8% |
| Seminole | 0.0 /100 | #334 | Tragic 6.8% |
| Ottawa | 0.0 /100 | #335 | Tragic 6.8% |
| Chickasaw | 0.0 /100 | #336 | Tragic 6.8% |
| Creek | 0.0 /100 | #337 | Tragic 6.9% |
| Iroquois | 0.0 /100 | #338 | Tragic 6.9% |
| Choctaw | 0.0 /100 | #339 | Tragic 6.9% |
| Cherokee | 0.0 /100 | #340 | Tragic 6.9% |
| Cape Verdeans | 0.0 /100 | #341 | Tragic 7.0% |
| Chippewa | 0.0 /100 | #342 | Tragic 7.1% |
| Immigrants | Cabo Verde | 0.0 /100 | #343 | Tragic 7.1% |
| Cajuns | 0.0 /100 | #344 | Tragic 7.2% |
| Tsimshian | 0.0 /100 | #345 | Tragic 7.9% |
| Puerto Ricans | 0.0 /100 | #346 | Tragic 8.3% |
| Houma | 0.0 /100 | #347 | Tragic 9.1% |