Ottawa vs Burmese Disability Age 5 to 17
COMPARE
Ottawa
Burmese
Disability Age 5 to 17
Disability Age 5 to 17 Comparison
Ottawa
Burmese
6.8%
DISABILITY AGE 5 TO 17
0.0/ 100
METRIC RATING
335th/ 347
METRIC RANK
4.8%
DISABILITY AGE 5 TO 17
100.0/ 100
METRIC RATING
20th/ 347
METRIC RANK
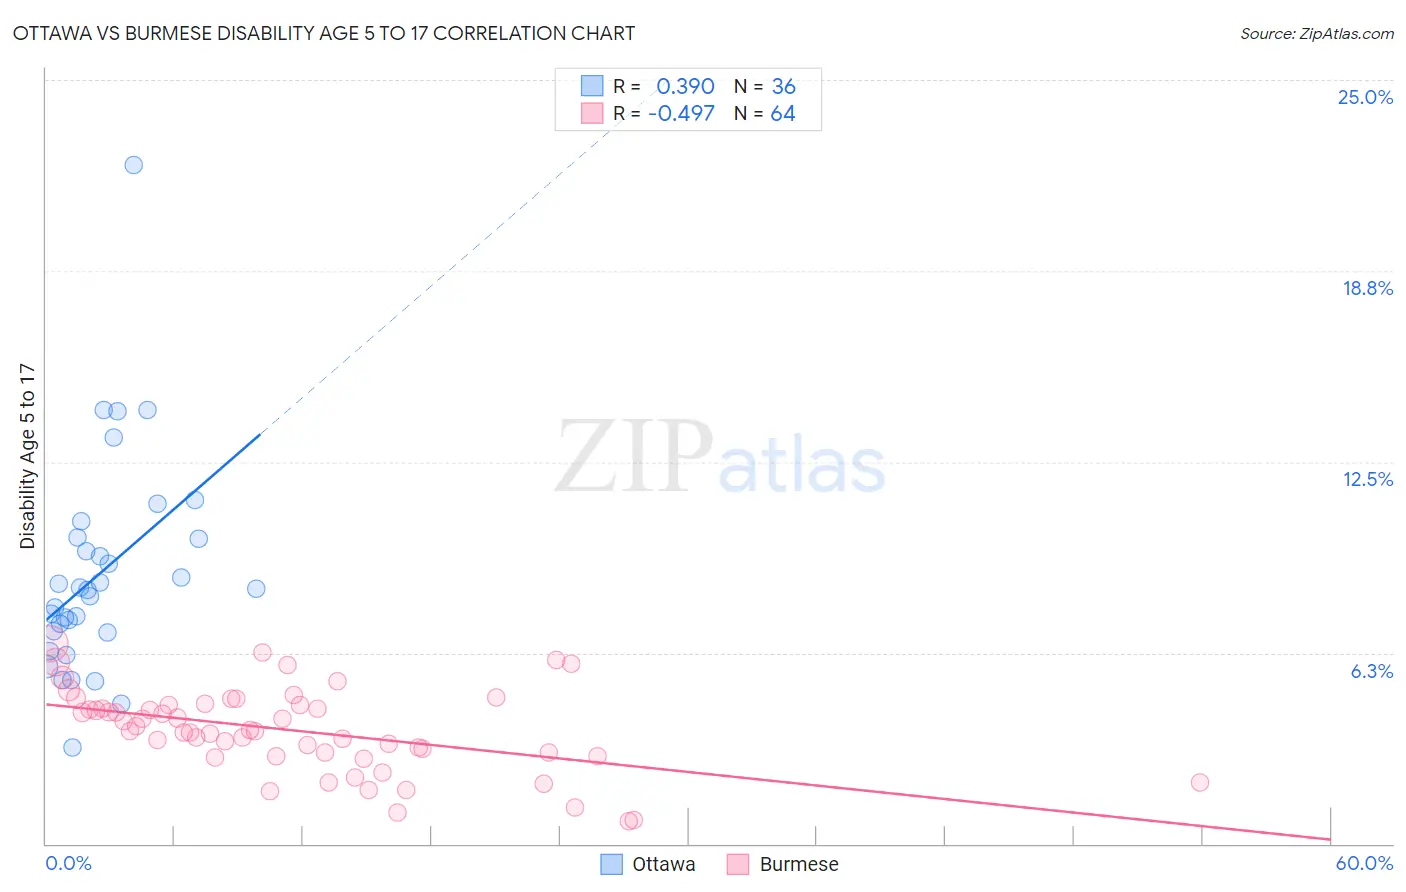
Ottawa vs Burmese Disability Age 5 to 17 Correlation Chart
The statistical analysis conducted on geographies consisting of 49,831,425 people shows a mild positive correlation between the proportion of Ottawa and percentage of population with a disability between the ages 5 and 17 in the United States with a correlation coefficient (R) of 0.390 and weighted average of 6.8%. Similarly, the statistical analysis conducted on geographies consisting of 460,493,605 people shows a moderate negative correlation between the proportion of Burmese and percentage of population with a disability between the ages 5 and 17 in the United States with a correlation coefficient (R) of -0.497 and weighted average of 4.8%, a difference of 42.4%.
Disability Age 5 to 17 Correlation Summary
| Measurement | Ottawa | Burmese |
| Minimum | 3.1% | 0.73% |
| Maximum | 22.2% | 6.5% |
| Range | 19.1% | 5.8% |
| Mean | 8.8% | 3.7% |
| Median | 8.3% | 3.7% |
| Interquartile 25% (IQ1) | 6.9% | 2.9% |
| Interquartile 75% (IQ3) | 10.0% | 4.5% |
| Interquartile Range (IQR) | 3.1% | 1.6% |
| Standard Deviation (Sample) | 3.5% | 1.4% |
| Standard Deviation (Population) | 3.5% | 1.3% |
Similar Demographics by Disability Age 5 to 17
Demographics Similar to Ottawa by Disability Age 5 to 17
In terms of disability age 5 to 17, the demographic groups most similar to Ottawa are Chickasaw (6.8%, a difference of 0.50%), Seminole (6.8%, a difference of 0.70%), Black/African American (6.8%, a difference of 0.75%), Creek (6.9%, a difference of 0.93%), and Iroquois (6.9%, a difference of 1.2%).
| Demographics | Rating | Rank | Disability Age 5 to 17 |
| Pennsylvania Germans | 0.0 /100 | #328 | Tragic 6.6% |
| Blackfeet | 0.0 /100 | #329 | Tragic 6.6% |
| Dutch West Indians | 0.0 /100 | #330 | Tragic 6.7% |
| French Canadians | 0.0 /100 | #331 | Tragic 6.7% |
| Immigrants | Azores | 0.0 /100 | #332 | Tragic 6.7% |
| Blacks/African Americans | 0.0 /100 | #333 | Tragic 6.8% |
| Seminole | 0.0 /100 | #334 | Tragic 6.8% |
| Ottawa | 0.0 /100 | #335 | Tragic 6.8% |
| Chickasaw | 0.0 /100 | #336 | Tragic 6.8% |
| Creek | 0.0 /100 | #337 | Tragic 6.9% |
| Iroquois | 0.0 /100 | #338 | Tragic 6.9% |
| Choctaw | 0.0 /100 | #339 | Tragic 6.9% |
| Cherokee | 0.0 /100 | #340 | Tragic 6.9% |
| Cape Verdeans | 0.0 /100 | #341 | Tragic 7.0% |
| Chippewa | 0.0 /100 | #342 | Tragic 7.1% |
Demographics Similar to Burmese by Disability Age 5 to 17
In terms of disability age 5 to 17, the demographic groups most similar to Burmese are Yup'ik (4.8%, a difference of 0.22%), Immigrants from Uzbekistan (4.8%, a difference of 0.38%), Asian (4.8%, a difference of 0.56%), Immigrants from South Central Asia (4.7%, a difference of 0.87%), and Arapaho (4.7%, a difference of 0.89%).
| Demographics | Rating | Rank | Disability Age 5 to 17 |
| Thais | 100.0 /100 | #13 | Exceptional 4.7% |
| Immigrants | Korea | 100.0 /100 | #14 | Exceptional 4.7% |
| Chinese | 100.0 /100 | #15 | Exceptional 4.7% |
| Immigrants | Singapore | 100.0 /100 | #16 | Exceptional 4.7% |
| Arapaho | 100.0 /100 | #17 | Exceptional 4.7% |
| Immigrants | South Central Asia | 100.0 /100 | #18 | Exceptional 4.7% |
| Immigrants | Uzbekistan | 100.0 /100 | #19 | Exceptional 4.8% |
| Burmese | 100.0 /100 | #20 | Exceptional 4.8% |
| Yup'ik | 100.0 /100 | #21 | Exceptional 4.8% |
| Asians | 100.0 /100 | #22 | Exceptional 4.8% |
| Immigrants | Bolivia | 100.0 /100 | #23 | Exceptional 4.8% |
| Immigrants | Lebanon | 100.0 /100 | #24 | Exceptional 4.8% |
| Immigrants | Asia | 100.0 /100 | #25 | Exceptional 4.8% |
| Bhutanese | 100.0 /100 | #26 | Exceptional 4.9% |
| Taiwanese | 100.0 /100 | #27 | Exceptional 4.9% |