Osage vs Argentinean Disability Age 35 to 64
COMPARE
Osage
Argentinean
Disability Age 35 to 64
Disability Age 35 to 64 Comparison
Osage
Argentineans
14.5%
DISABILITY AGE 35 TO 64
0.0/ 100
METRIC RATING
316th/ 347
METRIC RANK
9.4%
DISABILITY AGE 35 TO 64
100.0/ 100
METRIC RATING
23rd/ 347
METRIC RANK
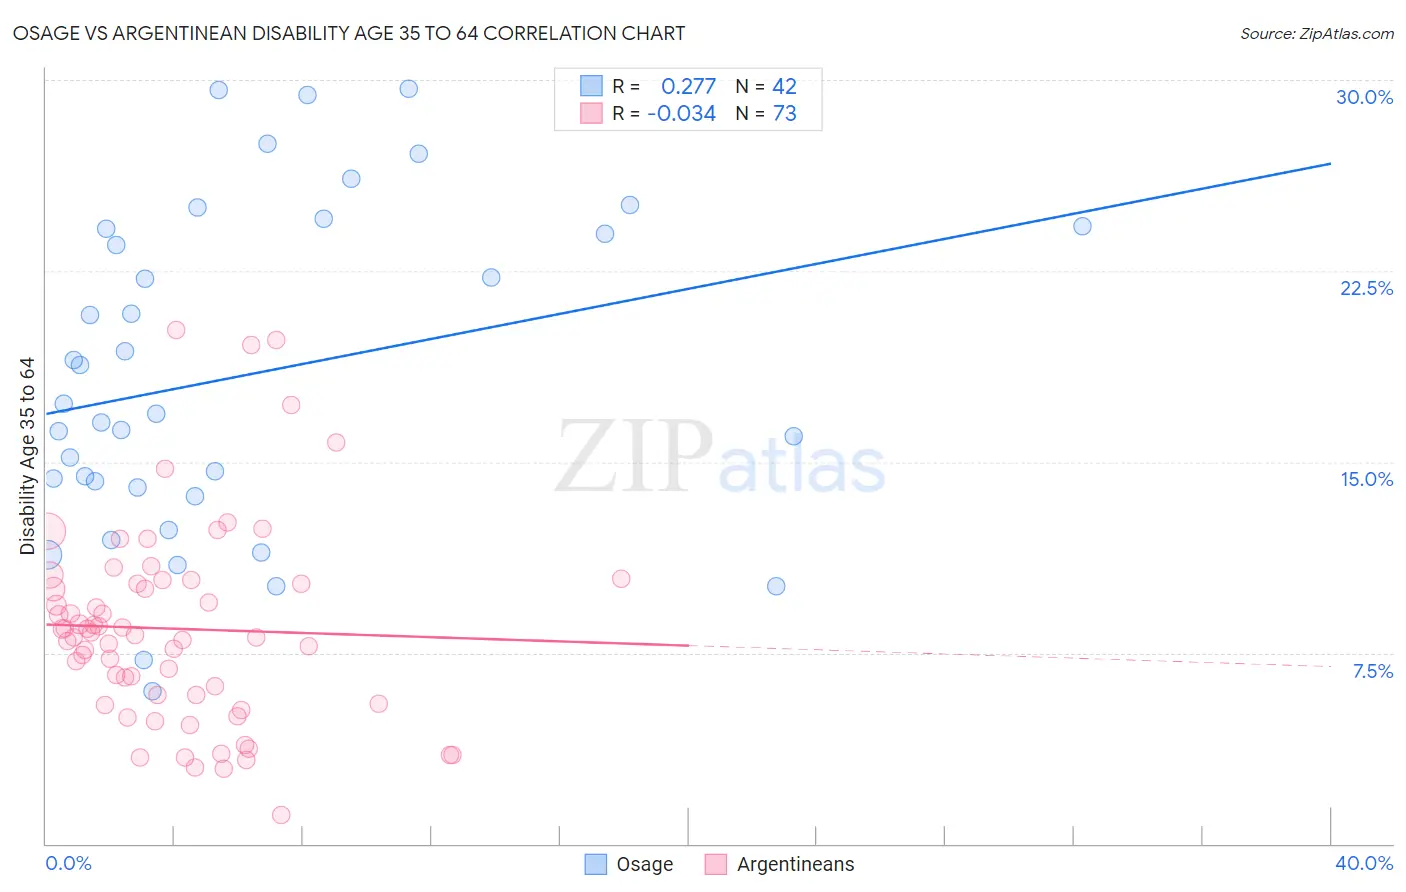
Osage vs Argentinean Disability Age 35 to 64 Correlation Chart
The statistical analysis conducted on geographies consisting of 91,796,232 people shows a weak positive correlation between the proportion of Osage and percentage of population with a disability between the ages 34 and 64 in the United States with a correlation coefficient (R) of 0.277 and weighted average of 14.5%. Similarly, the statistical analysis conducted on geographies consisting of 296,962,722 people shows no correlation between the proportion of Argentineans and percentage of population with a disability between the ages 34 and 64 in the United States with a correlation coefficient (R) of -0.034 and weighted average of 9.4%, a difference of 54.4%.
Disability Age 35 to 64 Correlation Summary
| Measurement | Osage | Argentinean |
| Minimum | 6.0% | 1.1% |
| Maximum | 29.7% | 20.2% |
| Range | 23.7% | 19.0% |
| Mean | 18.4% | 8.4% |
| Median | 17.1% | 8.2% |
| Interquartile 25% (IQ1) | 14.0% | 5.7% |
| Interquartile 75% (IQ3) | 24.2% | 10.3% |
| Interquartile Range (IQR) | 10.2% | 4.6% |
| Standard Deviation (Sample) | 6.4% | 3.9% |
| Standard Deviation (Population) | 6.3% | 3.9% |
Similar Demographics by Disability Age 35 to 64
Demographics Similar to Osage by Disability Age 35 to 64
In terms of disability age 35 to 64, the demographic groups most similar to Osage are Alaska Native (14.5%, a difference of 0.19%), Shoshone (14.5%, a difference of 0.21%), Crow (14.6%, a difference of 0.87%), Ottawa (14.6%, a difference of 0.95%), and Iroquois (14.4%, a difference of 0.97%).
| Demographics | Rating | Rank | Disability Age 35 to 64 |
| Cree | 0.0 /100 | #309 | Tragic 14.1% |
| Cape Verdeans | 0.0 /100 | #310 | Tragic 14.1% |
| Immigrants | Azores | 0.0 /100 | #311 | Tragic 14.3% |
| Paiute | 0.0 /100 | #312 | Tragic 14.3% |
| Iroquois | 0.0 /100 | #313 | Tragic 14.4% |
| Shoshone | 0.0 /100 | #314 | Tragic 14.5% |
| Alaska Natives | 0.0 /100 | #315 | Tragic 14.5% |
| Osage | 0.0 /100 | #316 | Tragic 14.5% |
| Crow | 0.0 /100 | #317 | Tragic 14.6% |
| Ottawa | 0.0 /100 | #318 | Tragic 14.6% |
| Immigrants | Cabo Verde | 0.0 /100 | #319 | Tragic 14.7% |
| Blacks/African Americans | 0.0 /100 | #320 | Tragic 14.7% |
| Comanche | 0.0 /100 | #321 | Tragic 14.7% |
| Potawatomi | 0.0 /100 | #322 | Tragic 14.8% |
| Apache | 0.0 /100 | #323 | Tragic 14.9% |
Demographics Similar to Argentineans by Disability Age 35 to 64
In terms of disability age 35 to 64, the demographic groups most similar to Argentineans are Asian (9.4%, a difference of 0.010%), Cypriot (9.4%, a difference of 0.22%), Okinawan (9.4%, a difference of 0.25%), Venezuelan (9.4%, a difference of 0.31%), and Immigrants from Argentina (9.3%, a difference of 0.68%).
| Demographics | Rating | Rank | Disability Age 35 to 64 |
| Immigrants | Korea | 100.0 /100 | #16 | Exceptional 9.0% |
| Burmese | 100.0 /100 | #17 | Exceptional 9.2% |
| Soviet Union | 100.0 /100 | #18 | Exceptional 9.2% |
| Immigrants | Venezuela | 100.0 /100 | #19 | Exceptional 9.3% |
| Immigrants | Argentina | 100.0 /100 | #20 | Exceptional 9.3% |
| Okinawans | 100.0 /100 | #21 | Exceptional 9.4% |
| Cypriots | 100.0 /100 | #22 | Exceptional 9.4% |
| Argentineans | 100.0 /100 | #23 | Exceptional 9.4% |
| Asians | 100.0 /100 | #24 | Exceptional 9.4% |
| Venezuelans | 100.0 /100 | #25 | Exceptional 9.4% |
| Immigrants | Sri Lanka | 100.0 /100 | #26 | Exceptional 9.5% |
| Immigrants | Asia | 100.0 /100 | #27 | Exceptional 9.5% |
| Immigrants | Pakistan | 100.0 /100 | #28 | Exceptional 9.5% |
| Immigrants | Ireland | 100.0 /100 | #29 | Exceptional 9.5% |
| Immigrants | Japan | 100.0 /100 | #30 | Exceptional 9.5% |