Osage vs Immigrants from Cabo Verde In Labor Force | Age 30-34
COMPARE
Osage
Immigrants from Cabo Verde
In Labor Force | Age 30-34
In Labor Force | Age 30-34 Comparison
Osage
Immigrants from Cabo Verde
82.3%
IN LABOR FORCE | AGE 30-34
0.0/ 100
METRIC RATING
305th/ 347
METRIC RANK
86.1%
IN LABOR FORCE | AGE 30-34
100.0/ 100
METRIC RATING
14th/ 347
METRIC RANK
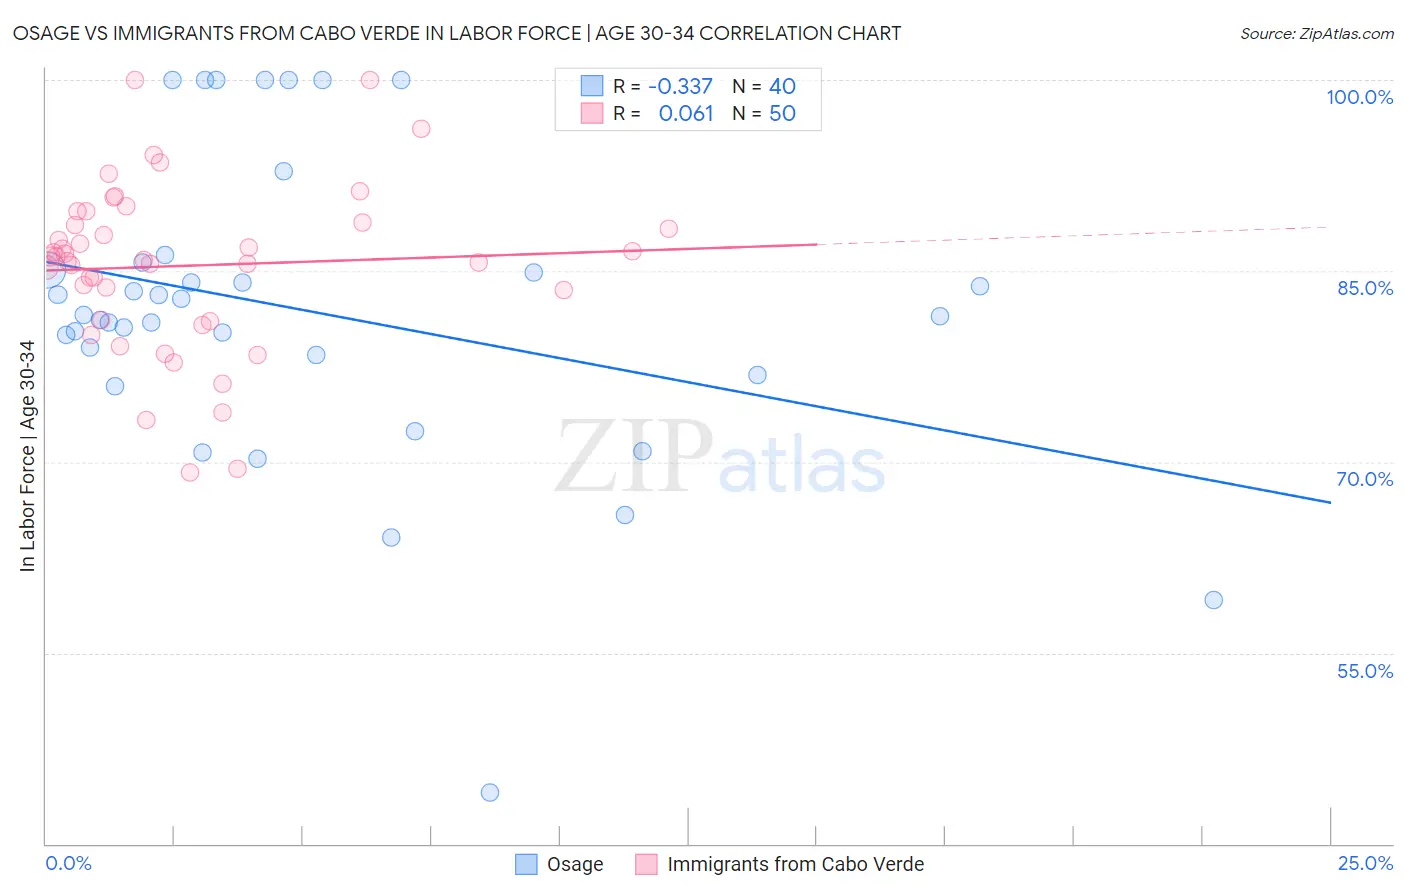
Osage vs Immigrants from Cabo Verde In Labor Force | Age 30-34 Correlation Chart
The statistical analysis conducted on geographies consisting of 91,795,365 people shows a mild negative correlation between the proportion of Osage and labor force participation rate among population between the ages 30 and 34 in the United States with a correlation coefficient (R) of -0.337 and weighted average of 82.3%. Similarly, the statistical analysis conducted on geographies consisting of 38,153,074 people shows a slight positive correlation between the proportion of Immigrants from Cabo Verde and labor force participation rate among population between the ages 30 and 34 in the United States with a correlation coefficient (R) of 0.061 and weighted average of 86.1%, a difference of 4.7%.
In Labor Force | Age 30-34 Correlation Summary
| Measurement | Osage | Immigrants from Cabo Verde |
| Minimum | 44.0% | 69.2% |
| Maximum | 100.0% | 100.0% |
| Range | 56.0% | 30.8% |
| Mean | 81.8% | 85.4% |
| Median | 81.5% | 86.0% |
| Interquartile 25% (IQ1) | 77.6% | 81.2% |
| Interquartile 75% (IQ3) | 85.4% | 88.8% |
| Interquartile Range (IQR) | 7.8% | 7.6% |
| Standard Deviation (Sample) | 12.0% | 6.6% |
| Standard Deviation (Population) | 11.8% | 6.5% |
Similar Demographics by In Labor Force | Age 30-34
Demographics Similar to Osage by In Labor Force | Age 30-34
In terms of in labor force | age 30-34, the demographic groups most similar to Osage are Spanish American Indian (82.2%, a difference of 0.020%), Menominee (82.2%, a difference of 0.070%), Tlingit-Haida (82.3%, a difference of 0.080%), Immigrants from Micronesia (82.4%, a difference of 0.16%), and Ottawa (82.4%, a difference of 0.17%).
| Demographics | Rating | Rank | In Labor Force | Age 30-34 |
| Aleuts | 0.0 /100 | #298 | Tragic 82.6% |
| Immigrants | Central America | 0.0 /100 | #299 | Tragic 82.5% |
| Hmong | 0.0 /100 | #300 | Tragic 82.4% |
| Hispanics or Latinos | 0.0 /100 | #301 | Tragic 82.4% |
| Ottawa | 0.0 /100 | #302 | Tragic 82.4% |
| Immigrants | Micronesia | 0.0 /100 | #303 | Tragic 82.4% |
| Tlingit-Haida | 0.0 /100 | #304 | Tragic 82.3% |
| Osage | 0.0 /100 | #305 | Tragic 82.3% |
| Spanish American Indians | 0.0 /100 | #306 | Tragic 82.2% |
| Menominee | 0.0 /100 | #307 | Tragic 82.2% |
| Puget Sound Salish | 0.0 /100 | #308 | Tragic 82.1% |
| Immigrants | Mexico | 0.0 /100 | #309 | Tragic 82.0% |
| Cajuns | 0.0 /100 | #310 | Tragic 82.0% |
| Chickasaw | 0.0 /100 | #311 | Tragic 81.9% |
| Mexicans | 0.0 /100 | #312 | Tragic 81.9% |
Demographics Similar to Immigrants from Cabo Verde by In Labor Force | Age 30-34
In terms of in labor force | age 30-34, the demographic groups most similar to Immigrants from Cabo Verde are Immigrants from Croatia (86.1%, a difference of 0.010%), Immigrants from Albania (86.1%, a difference of 0.010%), Bolivian (86.1%, a difference of 0.020%), Latvian (86.0%, a difference of 0.040%), and Immigrants from Cameroon (86.0%, a difference of 0.050%).
| Demographics | Rating | Rank | In Labor Force | Age 30-34 |
| Immigrants | Bolivia | 100.0 /100 | #7 | Exceptional 86.2% |
| Cambodians | 100.0 /100 | #8 | Exceptional 86.2% |
| Immigrants | Somalia | 100.0 /100 | #9 | Exceptional 86.2% |
| Immigrants | Serbia | 100.0 /100 | #10 | Exceptional 86.2% |
| Carpatho Rusyns | 100.0 /100 | #11 | Exceptional 86.2% |
| Bolivians | 100.0 /100 | #12 | Exceptional 86.1% |
| Immigrants | Croatia | 100.0 /100 | #13 | Exceptional 86.1% |
| Immigrants | Cabo Verde | 100.0 /100 | #14 | Exceptional 86.1% |
| Immigrants | Albania | 100.0 /100 | #15 | Exceptional 86.1% |
| Latvians | 100.0 /100 | #16 | Exceptional 86.0% |
| Immigrants | Cameroon | 100.0 /100 | #17 | Exceptional 86.0% |
| Immigrants | Sierra Leone | 100.0 /100 | #18 | Exceptional 86.0% |
| Sierra Leoneans | 100.0 /100 | #19 | Exceptional 86.0% |
| Bulgarians | 100.0 /100 | #20 | Exceptional 86.0% |
| Immigrants | Bulgaria | 100.0 /100 | #21 | Exceptional 86.0% |