Fijian vs Immigrants from Ethiopia Cognitive Disability
COMPARE
Fijian
Immigrants from Ethiopia
Cognitive Disability
Cognitive Disability Comparison
Fijians
Immigrants from Ethiopia
17.7%
COGNITIVE DISABILITY
3.4/ 100
METRIC RATING
224th/ 347
METRIC RANK
17.9%
COGNITIVE DISABILITY
0.7/ 100
METRIC RATING
250th/ 347
METRIC RANK
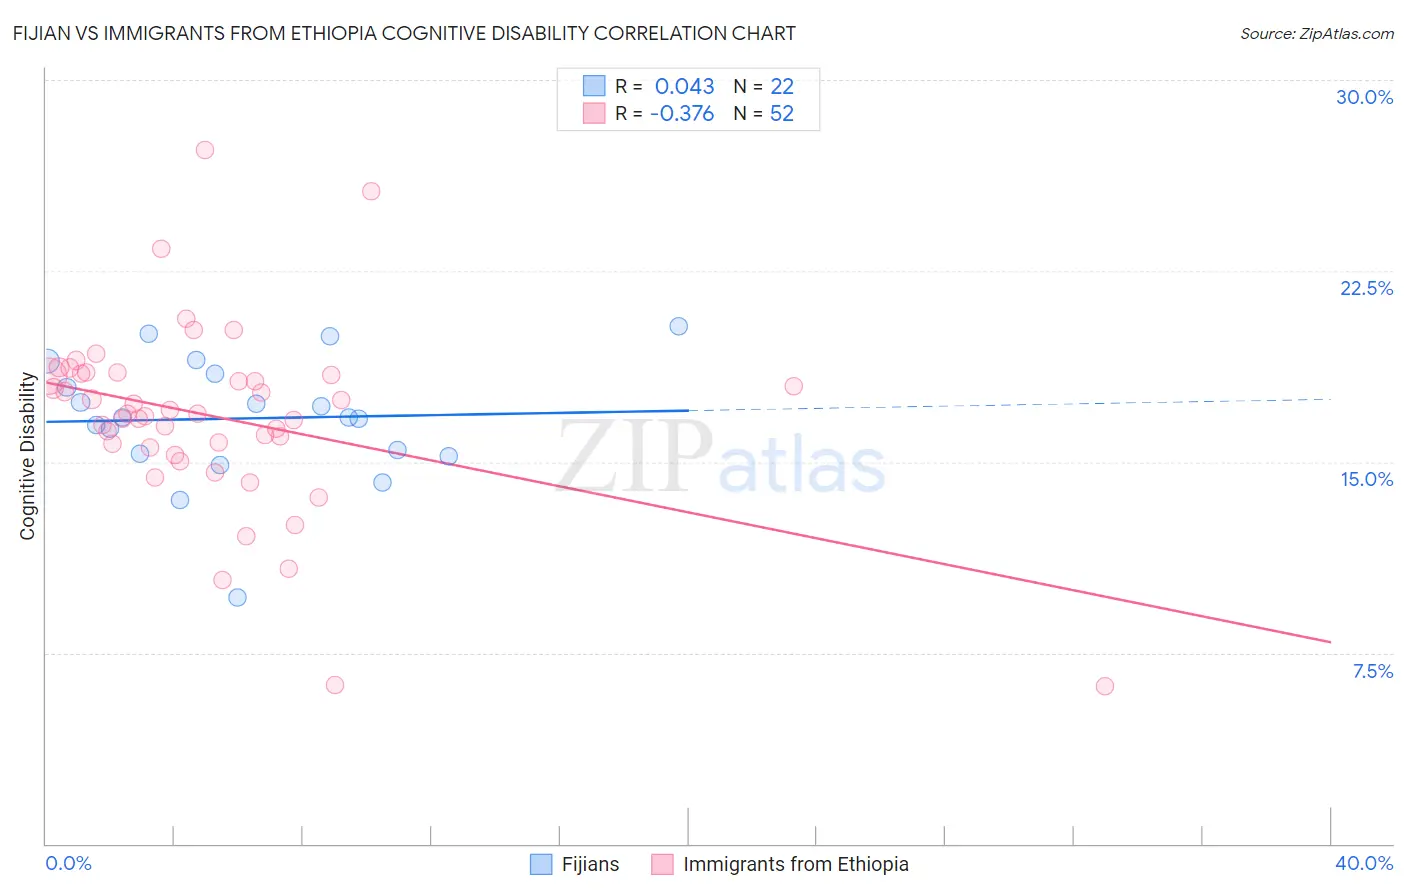
Fijian vs Immigrants from Ethiopia Cognitive Disability Correlation Chart
The statistical analysis conducted on geographies consisting of 55,934,490 people shows no correlation between the proportion of Fijians and percentage of population with cognitive disability in the United States with a correlation coefficient (R) of 0.043 and weighted average of 17.7%. Similarly, the statistical analysis conducted on geographies consisting of 211,556,639 people shows a mild negative correlation between the proportion of Immigrants from Ethiopia and percentage of population with cognitive disability in the United States with a correlation coefficient (R) of -0.376 and weighted average of 17.9%, a difference of 1.2%.
Cognitive Disability Correlation Summary
| Measurement | Fijian | Immigrants from Ethiopia |
| Minimum | 9.7% | 6.2% |
| Maximum | 20.3% | 27.2% |
| Range | 10.6% | 21.1% |
| Mean | 16.7% | 16.8% |
| Median | 16.7% | 16.9% |
| Interquartile 25% (IQ1) | 15.3% | 15.6% |
| Interquartile 75% (IQ3) | 18.4% | 18.4% |
| Interquartile Range (IQR) | 3.1% | 2.8% |
| Standard Deviation (Sample) | 2.4% | 3.7% |
| Standard Deviation (Population) | 2.4% | 3.6% |
Similar Demographics by Cognitive Disability
Demographics Similar to Fijians by Cognitive Disability
In terms of cognitive disability, the demographic groups most similar to Fijians are Vietnamese (17.7%, a difference of 0.010%), Marshallese (17.7%, a difference of 0.17%), Alsatian (17.7%, a difference of 0.19%), Central American (17.7%, a difference of 0.20%), and Immigrants from St. Vincent and the Grenadines (17.7%, a difference of 0.20%).
| Demographics | Rating | Rank | Cognitive Disability |
| Salvadorans | 6.7 /100 | #217 | Tragic 17.6% |
| Icelanders | 6.4 /100 | #218 | Tragic 17.6% |
| Immigrants | Sierra Leone | 6.3 /100 | #219 | Tragic 17.6% |
| Zimbabweans | 6.1 /100 | #220 | Tragic 17.6% |
| Moroccans | 5.9 /100 | #221 | Tragic 17.6% |
| Central Americans | 4.5 /100 | #222 | Tragic 17.7% |
| Alsatians | 4.5 /100 | #223 | Tragic 17.7% |
| Fijians | 3.4 /100 | #224 | Tragic 17.7% |
| Vietnamese | 3.4 /100 | #225 | Tragic 17.7% |
| Marshallese | 2.7 /100 | #226 | Tragic 17.7% |
| Immigrants | St. Vincent and the Grenadines | 2.6 /100 | #227 | Tragic 17.7% |
| Immigrants | Central America | 2.3 /100 | #228 | Tragic 17.7% |
| Immigrants | Guatemala | 2.2 /100 | #229 | Tragic 17.7% |
| Mongolians | 2.2 /100 | #230 | Tragic 17.7% |
| Guatemalans | 2.1 /100 | #231 | Tragic 17.8% |
Demographics Similar to Immigrants from Ethiopia by Cognitive Disability
In terms of cognitive disability, the demographic groups most similar to Immigrants from Ethiopia are Cree (17.9%, a difference of 0.0%), Malaysian (17.9%, a difference of 0.010%), Immigrants from Grenada (17.9%, a difference of 0.020%), Hopi (17.9%, a difference of 0.030%), and Hispanic or Latino (17.9%, a difference of 0.030%).
| Demographics | Rating | Rank | Cognitive Disability |
| Immigrants | Bangladesh | 1.0 /100 | #243 | Tragic 17.8% |
| Jamaicans | 0.9 /100 | #244 | Tragic 17.9% |
| Trinidadians and Tobagonians | 0.8 /100 | #245 | Tragic 17.9% |
| Immigrants | Thailand | 0.8 /100 | #246 | Tragic 17.9% |
| Samoans | 0.7 /100 | #247 | Tragic 17.9% |
| French American Indians | 0.7 /100 | #248 | Tragic 17.9% |
| Cree | 0.7 /100 | #249 | Tragic 17.9% |
| Immigrants | Ethiopia | 0.7 /100 | #250 | Tragic 17.9% |
| Malaysians | 0.6 /100 | #251 | Tragic 17.9% |
| Immigrants | Grenada | 0.6 /100 | #252 | Tragic 17.9% |
| Hopi | 0.6 /100 | #253 | Tragic 17.9% |
| Hispanics or Latinos | 0.6 /100 | #254 | Tragic 17.9% |
| Immigrants | Azores | 0.6 /100 | #255 | Tragic 17.9% |
| Bahamians | 0.6 /100 | #256 | Tragic 17.9% |
| Mexican American Indians | 0.6 /100 | #257 | Tragic 17.9% |