Immigrants from Czechoslovakia vs Immigrants from Ethiopia Cognitive Disability
COMPARE
Immigrants from Czechoslovakia
Immigrants from Ethiopia
Cognitive Disability
Cognitive Disability Comparison
Immigrants from Czechoslovakia
Immigrants from Ethiopia
16.2%
COGNITIVE DISABILITY
100.0/ 100
METRIC RATING
11th/ 347
METRIC RANK
17.9%
COGNITIVE DISABILITY
0.7/ 100
METRIC RATING
250th/ 347
METRIC RANK
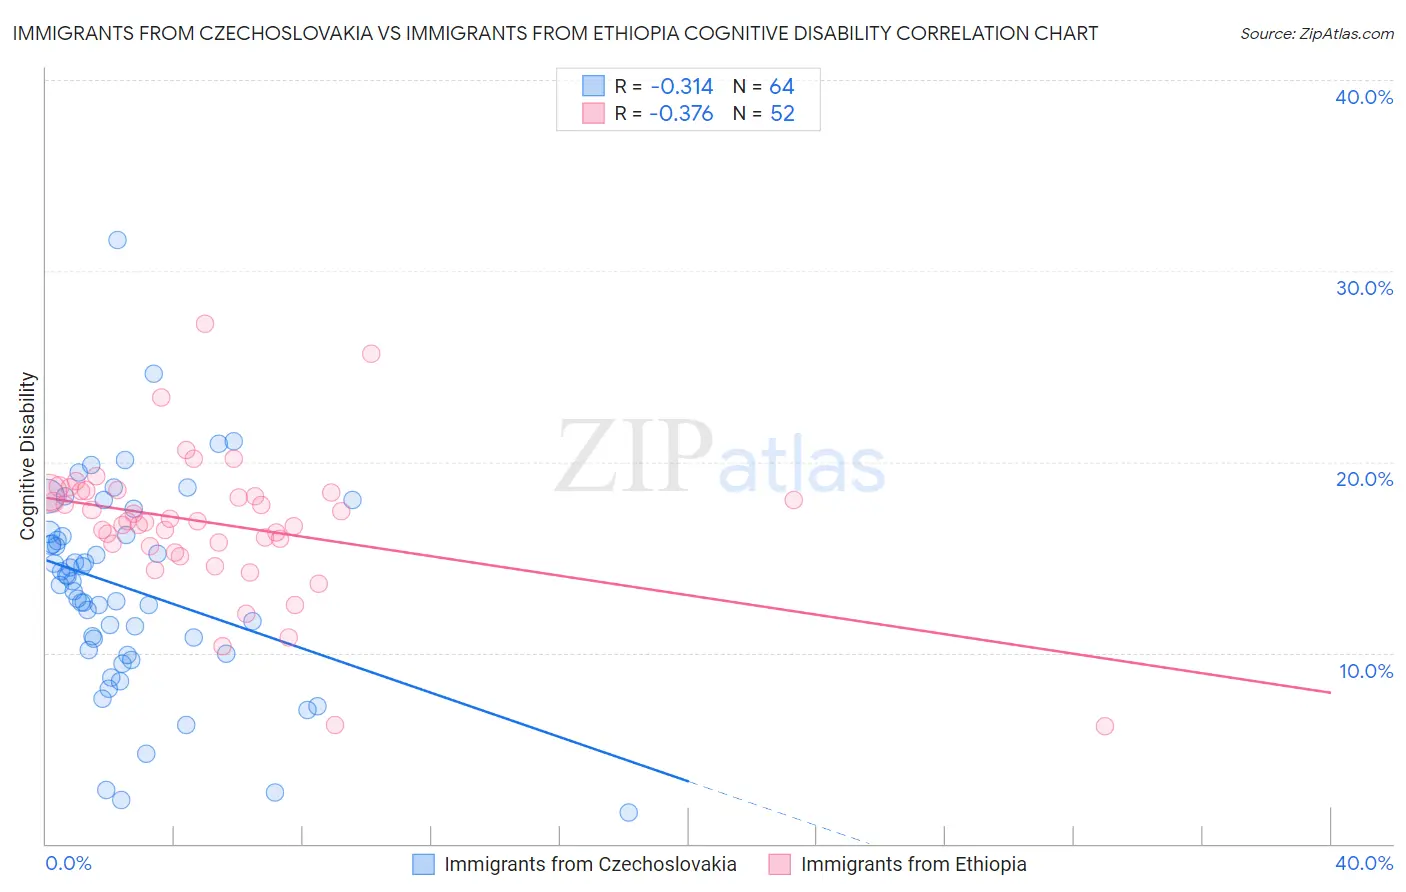
Immigrants from Czechoslovakia vs Immigrants from Ethiopia Cognitive Disability Correlation Chart
The statistical analysis conducted on geographies consisting of 195,454,125 people shows a mild negative correlation between the proportion of Immigrants from Czechoslovakia and percentage of population with cognitive disability in the United States with a correlation coefficient (R) of -0.314 and weighted average of 16.2%. Similarly, the statistical analysis conducted on geographies consisting of 211,556,639 people shows a mild negative correlation between the proportion of Immigrants from Ethiopia and percentage of population with cognitive disability in the United States with a correlation coefficient (R) of -0.376 and weighted average of 17.9%, a difference of 10.4%.
Cognitive Disability Correlation Summary
| Measurement | Immigrants from Czechoslovakia | Immigrants from Ethiopia |
| Minimum | 1.7% | 6.2% |
| Maximum | 31.6% | 27.2% |
| Range | 30.0% | 21.1% |
| Mean | 13.3% | 16.8% |
| Median | 13.6% | 16.9% |
| Interquartile 25% (IQ1) | 10.1% | 15.6% |
| Interquartile 75% (IQ3) | 16.1% | 18.4% |
| Interquartile Range (IQR) | 6.1% | 2.8% |
| Standard Deviation (Sample) | 5.4% | 3.7% |
| Standard Deviation (Population) | 5.3% | 3.6% |
Similar Demographics by Cognitive Disability
Demographics Similar to Immigrants from Czechoslovakia by Cognitive Disability
In terms of cognitive disability, the demographic groups most similar to Immigrants from Czechoslovakia are Immigrants from Scotland (16.2%, a difference of 0.080%), Assyrian/Chaldean/Syriac (16.2%, a difference of 0.13%), Maltese (16.2%, a difference of 0.16%), Lithuanian (16.3%, a difference of 0.25%), and Immigrants from Austria (16.3%, a difference of 0.31%).
| Demographics | Rating | Rank | Cognitive Disability |
| Immigrants | Lithuania | 100.0 /100 | #4 | Exceptional 16.0% |
| Immigrants | Hong Kong | 100.0 /100 | #5 | Exceptional 16.0% |
| Thais | 100.0 /100 | #6 | Exceptional 16.1% |
| Immigrants | Ireland | 100.0 /100 | #7 | Exceptional 16.1% |
| Immigrants | Poland | 100.0 /100 | #8 | Exceptional 16.1% |
| Assyrians/Chaldeans/Syriacs | 100.0 /100 | #9 | Exceptional 16.2% |
| Immigrants | Scotland | 100.0 /100 | #10 | Exceptional 16.2% |
| Immigrants | Czechoslovakia | 100.0 /100 | #11 | Exceptional 16.2% |
| Maltese | 100.0 /100 | #12 | Exceptional 16.2% |
| Lithuanians | 100.0 /100 | #13 | Exceptional 16.3% |
| Immigrants | Austria | 100.0 /100 | #14 | Exceptional 16.3% |
| Immigrants | Greece | 100.0 /100 | #15 | Exceptional 16.3% |
| Eastern Europeans | 100.0 /100 | #16 | Exceptional 16.3% |
| Immigrants | North Macedonia | 100.0 /100 | #17 | Exceptional 16.3% |
| Immigrants | Northern Europe | 100.0 /100 | #18 | Exceptional 16.3% |
Demographics Similar to Immigrants from Ethiopia by Cognitive Disability
In terms of cognitive disability, the demographic groups most similar to Immigrants from Ethiopia are Cree (17.9%, a difference of 0.0%), Malaysian (17.9%, a difference of 0.010%), Immigrants from Grenada (17.9%, a difference of 0.020%), Hopi (17.9%, a difference of 0.030%), and Hispanic or Latino (17.9%, a difference of 0.030%).
| Demographics | Rating | Rank | Cognitive Disability |
| Immigrants | Bangladesh | 1.0 /100 | #243 | Tragic 17.8% |
| Jamaicans | 0.9 /100 | #244 | Tragic 17.9% |
| Trinidadians and Tobagonians | 0.8 /100 | #245 | Tragic 17.9% |
| Immigrants | Thailand | 0.8 /100 | #246 | Tragic 17.9% |
| Samoans | 0.7 /100 | #247 | Tragic 17.9% |
| French American Indians | 0.7 /100 | #248 | Tragic 17.9% |
| Cree | 0.7 /100 | #249 | Tragic 17.9% |
| Immigrants | Ethiopia | 0.7 /100 | #250 | Tragic 17.9% |
| Malaysians | 0.6 /100 | #251 | Tragic 17.9% |
| Immigrants | Grenada | 0.6 /100 | #252 | Tragic 17.9% |
| Hopi | 0.6 /100 | #253 | Tragic 17.9% |
| Hispanics or Latinos | 0.6 /100 | #254 | Tragic 17.9% |
| Immigrants | Azores | 0.6 /100 | #255 | Tragic 17.9% |
| Bahamians | 0.6 /100 | #256 | Tragic 17.9% |
| Mexican American Indians | 0.6 /100 | #257 | Tragic 17.9% |