Argentinean vs Immigrants from Ethiopia Cognitive Disability
COMPARE
Argentinean
Immigrants from Ethiopia
Cognitive Disability
Cognitive Disability Comparison
Argentineans
Immigrants from Ethiopia
16.6%
COGNITIVE DISABILITY
99.6/ 100
METRIC RATING
63rd/ 347
METRIC RANK
17.9%
COGNITIVE DISABILITY
0.7/ 100
METRIC RATING
250th/ 347
METRIC RANK
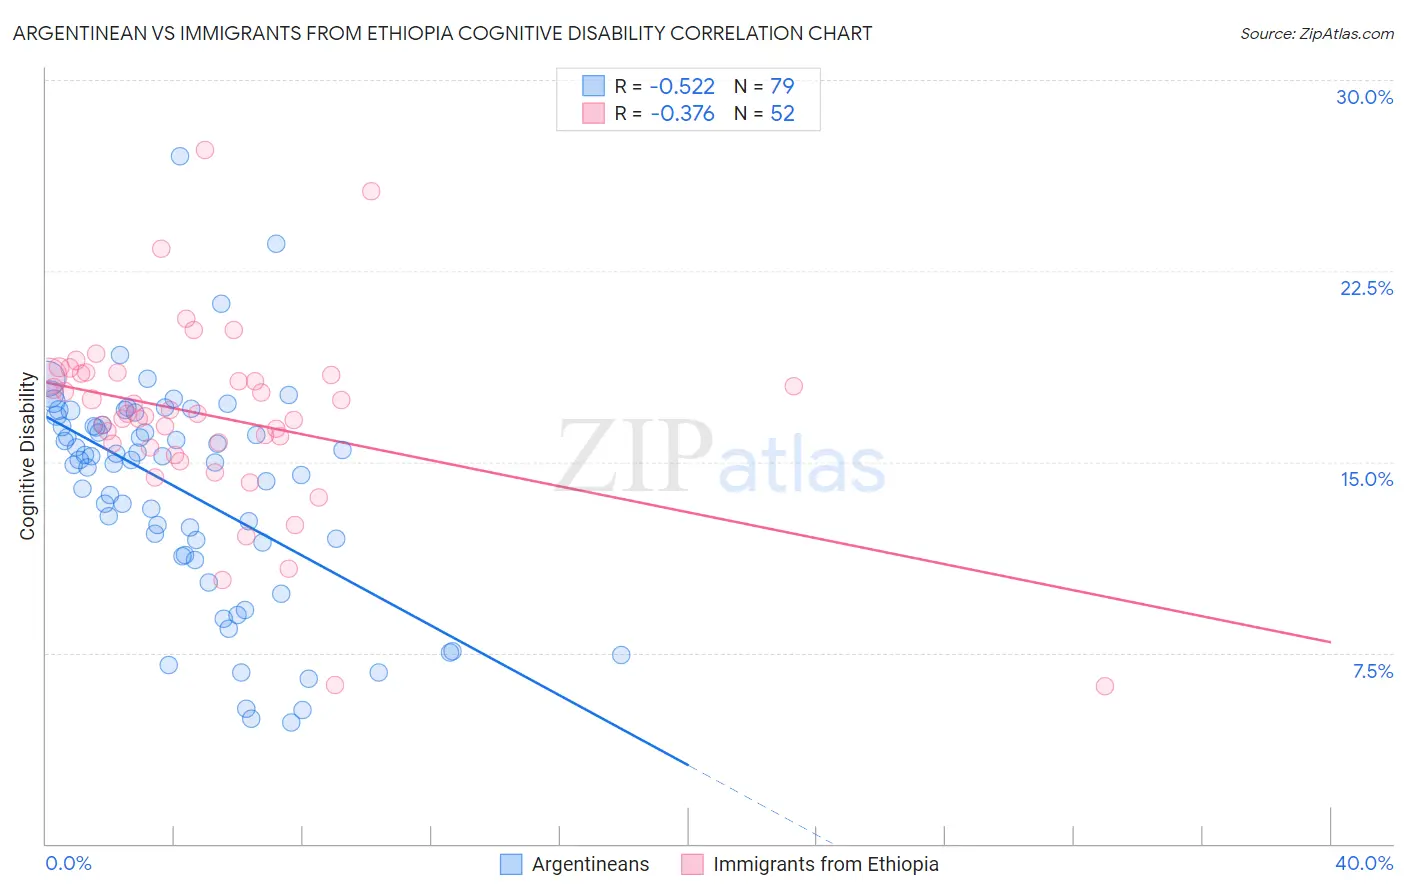
Argentinean vs Immigrants from Ethiopia Cognitive Disability Correlation Chart
The statistical analysis conducted on geographies consisting of 297,134,526 people shows a substantial negative correlation between the proportion of Argentineans and percentage of population with cognitive disability in the United States with a correlation coefficient (R) of -0.522 and weighted average of 16.6%. Similarly, the statistical analysis conducted on geographies consisting of 211,556,639 people shows a mild negative correlation between the proportion of Immigrants from Ethiopia and percentage of population with cognitive disability in the United States with a correlation coefficient (R) of -0.376 and weighted average of 17.9%, a difference of 7.8%.
Cognitive Disability Correlation Summary
| Measurement | Argentinean | Immigrants from Ethiopia |
| Minimum | 4.8% | 6.2% |
| Maximum | 27.0% | 27.2% |
| Range | 22.2% | 21.1% |
| Mean | 13.9% | 16.8% |
| Median | 15.1% | 16.9% |
| Interquartile 25% (IQ1) | 11.3% | 15.6% |
| Interquartile 75% (IQ3) | 16.5% | 18.4% |
| Interquartile Range (IQR) | 5.1% | 2.8% |
| Standard Deviation (Sample) | 4.3% | 3.7% |
| Standard Deviation (Population) | 4.2% | 3.6% |
Similar Demographics by Cognitive Disability
Demographics Similar to Argentineans by Cognitive Disability
In terms of cognitive disability, the demographic groups most similar to Argentineans are Czechoslovakian (16.6%, a difference of 0.020%), Immigrants from England (16.6%, a difference of 0.050%), Venezuelan (16.6%, a difference of 0.060%), Colombian (16.6%, a difference of 0.070%), and Romanian (16.6%, a difference of 0.12%).
| Demographics | Rating | Rank | Cognitive Disability |
| Austrians | 99.7 /100 | #56 | Exceptional 16.6% |
| Bhutanese | 99.7 /100 | #57 | Exceptional 16.6% |
| Pennsylvania Germans | 99.7 /100 | #58 | Exceptional 16.6% |
| Immigrants | Peru | 99.7 /100 | #59 | Exceptional 16.6% |
| Romanians | 99.7 /100 | #60 | Exceptional 16.6% |
| Immigrants | England | 99.6 /100 | #61 | Exceptional 16.6% |
| Czechoslovakians | 99.6 /100 | #62 | Exceptional 16.6% |
| Argentineans | 99.6 /100 | #63 | Exceptional 16.6% |
| Venezuelans | 99.6 /100 | #64 | Exceptional 16.6% |
| Colombians | 99.6 /100 | #65 | Exceptional 16.6% |
| Immigrants | Ukraine | 99.5 /100 | #66 | Exceptional 16.6% |
| Latvians | 99.5 /100 | #67 | Exceptional 16.6% |
| Ukrainians | 99.4 /100 | #68 | Exceptional 16.6% |
| Immigrants | Uzbekistan | 99.4 /100 | #69 | Exceptional 16.7% |
| Immigrants | Sweden | 99.4 /100 | #70 | Exceptional 16.7% |
Demographics Similar to Immigrants from Ethiopia by Cognitive Disability
In terms of cognitive disability, the demographic groups most similar to Immigrants from Ethiopia are Cree (17.9%, a difference of 0.0%), Malaysian (17.9%, a difference of 0.010%), Immigrants from Grenada (17.9%, a difference of 0.020%), Hopi (17.9%, a difference of 0.030%), and Hispanic or Latino (17.9%, a difference of 0.030%).
| Demographics | Rating | Rank | Cognitive Disability |
| Immigrants | Bangladesh | 1.0 /100 | #243 | Tragic 17.8% |
| Jamaicans | 0.9 /100 | #244 | Tragic 17.9% |
| Trinidadians and Tobagonians | 0.8 /100 | #245 | Tragic 17.9% |
| Immigrants | Thailand | 0.8 /100 | #246 | Tragic 17.9% |
| Samoans | 0.7 /100 | #247 | Tragic 17.9% |
| French American Indians | 0.7 /100 | #248 | Tragic 17.9% |
| Cree | 0.7 /100 | #249 | Tragic 17.9% |
| Immigrants | Ethiopia | 0.7 /100 | #250 | Tragic 17.9% |
| Malaysians | 0.6 /100 | #251 | Tragic 17.9% |
| Immigrants | Grenada | 0.6 /100 | #252 | Tragic 17.9% |
| Hopi | 0.6 /100 | #253 | Tragic 17.9% |
| Hispanics or Latinos | 0.6 /100 | #254 | Tragic 17.9% |
| Immigrants | Azores | 0.6 /100 | #255 | Tragic 17.9% |
| Bahamians | 0.6 /100 | #256 | Tragic 17.9% |
| Mexican American Indians | 0.6 /100 | #257 | Tragic 17.9% |