Northern European vs Immigrants from Kuwait Vision Disability
COMPARE
Northern European
Immigrants from Kuwait
Vision Disability
Vision Disability Comparison
Northern Europeans
Immigrants from Kuwait
2.2%
VISION DISABILITY
50.1/ 100
METRIC RATING
172nd/ 347
METRIC RANK
2.0%
VISION DISABILITY
99.8/ 100
METRIC RATING
38th/ 347
METRIC RANK
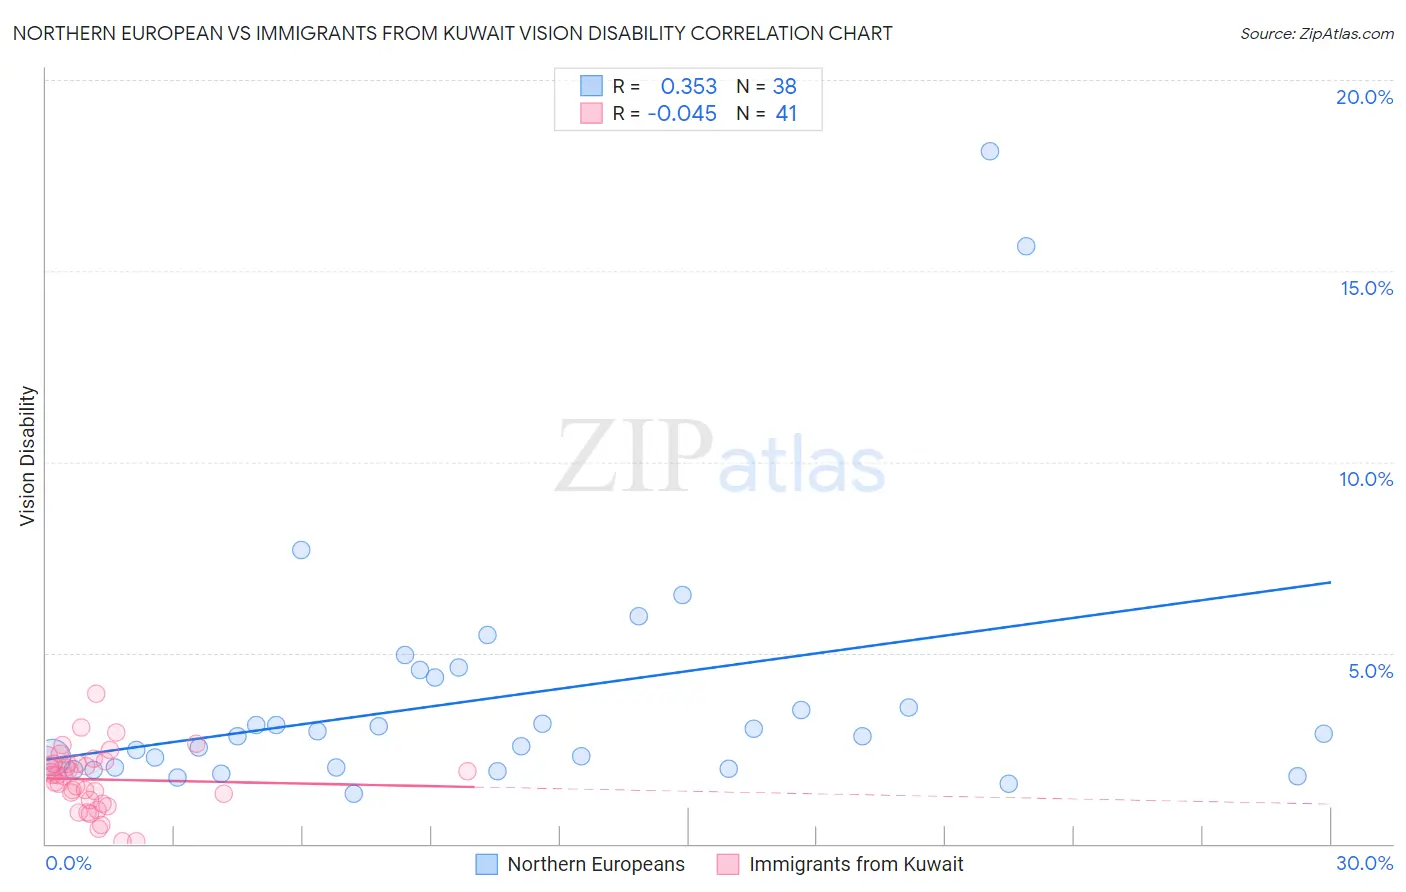
Northern European vs Immigrants from Kuwait Vision Disability Correlation Chart
The statistical analysis conducted on geographies consisting of 405,711,615 people shows a mild positive correlation between the proportion of Northern Europeans and percentage of population with vision disability in the United States with a correlation coefficient (R) of 0.353 and weighted average of 2.2%. Similarly, the statistical analysis conducted on geographies consisting of 136,909,771 people shows no correlation between the proportion of Immigrants from Kuwait and percentage of population with vision disability in the United States with a correlation coefficient (R) of -0.045 and weighted average of 2.0%, a difference of 10.4%.
Vision Disability Correlation Summary
| Measurement | Northern European | Immigrants from Kuwait |
| Minimum | 1.3% | 0.068% |
| Maximum | 18.1% | 3.9% |
| Range | 16.8% | 3.9% |
| Mean | 3.8% | 1.7% |
| Median | 2.8% | 1.8% |
| Interquartile 25% (IQ1) | 2.0% | 1.1% |
| Interquartile 75% (IQ3) | 4.4% | 2.1% |
| Interquartile Range (IQR) | 2.4% | 1.0% |
| Standard Deviation (Sample) | 3.5% | 0.81% |
| Standard Deviation (Population) | 3.4% | 0.80% |
Similar Demographics by Vision Disability
Demographics Similar to Northern Europeans by Vision Disability
In terms of vision disability, the demographic groups most similar to Northern Europeans are Scandinavian (2.2%, a difference of 0.0%), Immigrants from Canada (2.2%, a difference of 0.010%), Immigrants from Fiji (2.2%, a difference of 0.16%), Yugoslavian (2.2%, a difference of 0.22%), and Lebanese (2.2%, a difference of 0.26%).
| Demographics | Rating | Rank | Vision Disability |
| Immigrants | Iraq | 64.8 /100 | #165 | Good 2.1% |
| Immigrants | England | 62.8 /100 | #166 | Good 2.1% |
| Immigrants | Africa | 62.6 /100 | #167 | Good 2.1% |
| Brazilians | 62.2 /100 | #168 | Good 2.1% |
| South American Indians | 57.4 /100 | #169 | Average 2.2% |
| Swiss | 55.7 /100 | #170 | Average 2.2% |
| Lebanese | 54.3 /100 | #171 | Average 2.2% |
| Northern Europeans | 50.1 /100 | #172 | Average 2.2% |
| Scandinavians | 50.0 /100 | #173 | Average 2.2% |
| Immigrants | Canada | 50.0 /100 | #174 | Average 2.2% |
| Immigrants | Fiji | 47.6 /100 | #175 | Average 2.2% |
| Yugoslavians | 46.5 /100 | #176 | Average 2.2% |
| Slavs | 46.0 /100 | #177 | Average 2.2% |
| Immigrants | Oceania | 45.1 /100 | #178 | Average 2.2% |
| Immigrants | North America | 44.5 /100 | #179 | Average 2.2% |
Demographics Similar to Immigrants from Kuwait by Vision Disability
In terms of vision disability, the demographic groups most similar to Immigrants from Kuwait are Bhutanese (2.0%, a difference of 0.040%), Zimbabwean (2.0%, a difference of 0.060%), Immigrants from Ireland (2.0%, a difference of 0.26%), Cypriot (2.0%, a difference of 0.28%), and Cambodian (2.0%, a difference of 0.29%).
| Demographics | Rating | Rank | Vision Disability |
| Mongolians | 99.9 /100 | #31 | Exceptional 1.9% |
| Luxembourgers | 99.9 /100 | #32 | Exceptional 1.9% |
| Immigrants | Egypt | 99.9 /100 | #33 | Exceptional 1.9% |
| Immigrants | Turkey | 99.8 /100 | #34 | Exceptional 1.9% |
| Immigrants | Australia | 99.8 /100 | #35 | Exceptional 1.9% |
| Cambodians | 99.8 /100 | #36 | Exceptional 2.0% |
| Bhutanese | 99.8 /100 | #37 | Exceptional 2.0% |
| Immigrants | Kuwait | 99.8 /100 | #38 | Exceptional 2.0% |
| Zimbabweans | 99.7 /100 | #39 | Exceptional 2.0% |
| Immigrants | Ireland | 99.7 /100 | #40 | Exceptional 2.0% |
| Cypriots | 99.7 /100 | #41 | Exceptional 2.0% |
| Immigrants | Ethiopia | 99.7 /100 | #42 | Exceptional 2.0% |
| Eastern Europeans | 99.7 /100 | #43 | Exceptional 2.0% |
| Immigrants | Indonesia | 99.7 /100 | #44 | Exceptional 2.0% |
| Ethiopians | 99.7 /100 | #45 | Exceptional 2.0% |