Arapaho vs Bhutanese Female Disability
COMPARE
Arapaho
Bhutanese
Female Disability
Female Disability Comparison
Arapaho
Bhutanese
13.0%
FEMALE DISABILITY
0.1/ 100
METRIC RATING
279th/ 347
METRIC RANK
11.5%
FEMALE DISABILITY
99.8/ 100
METRIC RATING
74th/ 347
METRIC RANK
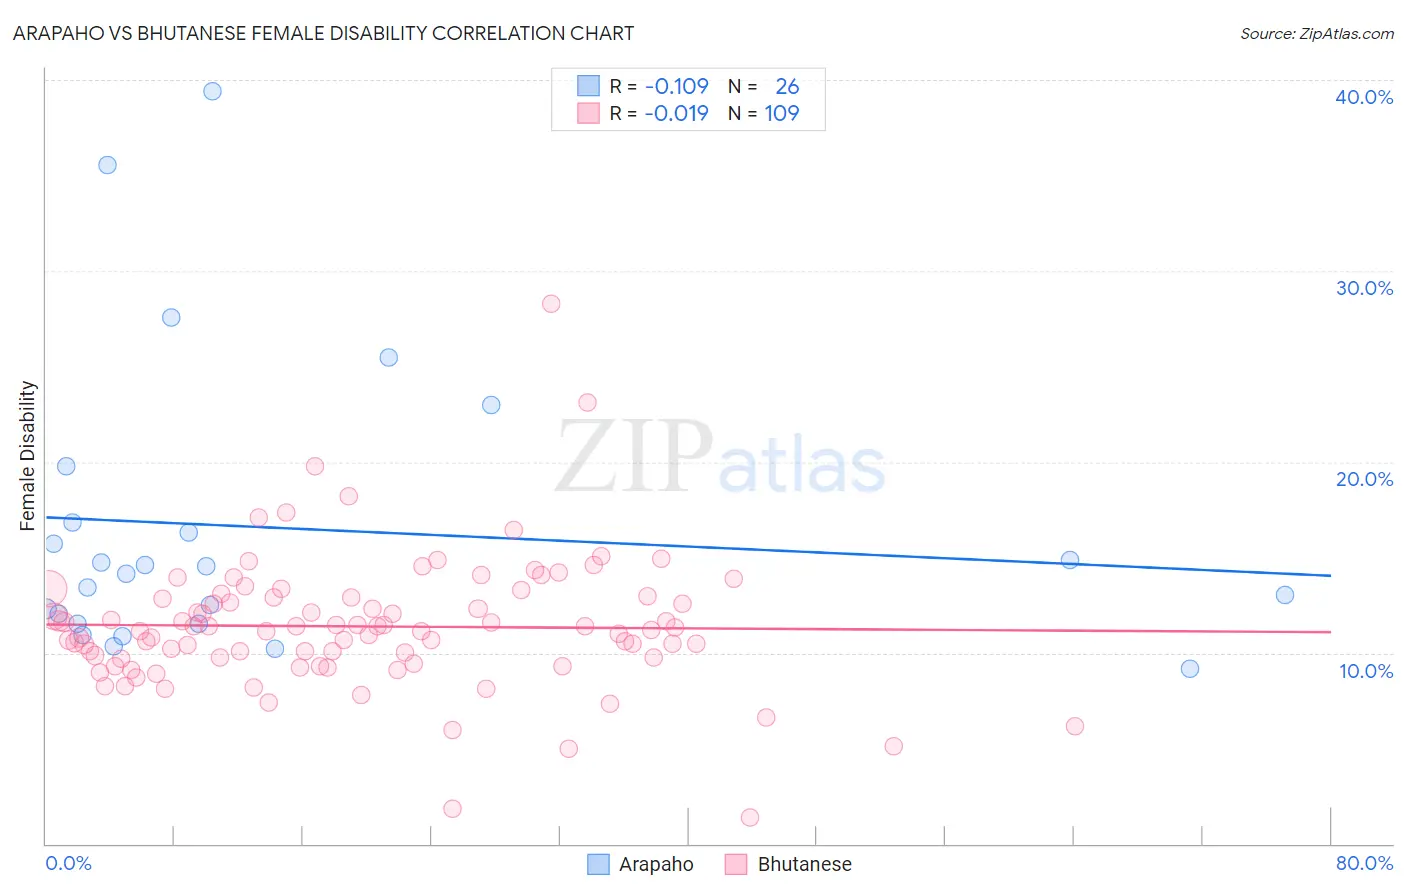
Arapaho vs Bhutanese Female Disability Correlation Chart
The statistical analysis conducted on geographies consisting of 29,780,107 people shows a poor negative correlation between the proportion of Arapaho and percentage of females with a disability in the United States with a correlation coefficient (R) of -0.109 and weighted average of 13.0%. Similarly, the statistical analysis conducted on geographies consisting of 455,486,745 people shows no correlation between the proportion of Bhutanese and percentage of females with a disability in the United States with a correlation coefficient (R) of -0.019 and weighted average of 11.5%, a difference of 13.4%.
Female Disability Correlation Summary
| Measurement | Arapaho | Bhutanese |
| Minimum | 9.2% | 1.4% |
| Maximum | 39.4% | 28.3% |
| Range | 30.2% | 26.9% |
| Mean | 16.6% | 11.4% |
| Median | 14.3% | 11.2% |
| Interquartile 25% (IQ1) | 11.5% | 9.7% |
| Interquartile 75% (IQ3) | 16.8% | 12.9% |
| Interquartile Range (IQR) | 5.3% | 3.2% |
| Standard Deviation (Sample) | 7.7% | 3.5% |
| Standard Deviation (Population) | 7.6% | 3.5% |
Similar Demographics by Female Disability
Demographics Similar to Arapaho by Female Disability
In terms of female disability, the demographic groups most similar to Arapaho are Irish (13.1%, a difference of 0.090%), U.S. Virgin Islander (13.1%, a difference of 0.12%), Welsh (13.1%, a difference of 0.20%), English (13.1%, a difference of 0.20%), and Scottish (13.0%, a difference of 0.24%).
| Demographics | Rating | Rank | Female Disability |
| Germans | 0.1 /100 | #272 | Tragic 12.9% |
| Sioux | 0.1 /100 | #273 | Tragic 12.9% |
| Portuguese | 0.1 /100 | #274 | Tragic 13.0% |
| Cheyenne | 0.1 /100 | #275 | Tragic 13.0% |
| Immigrants | Dominica | 0.1 /100 | #276 | Tragic 13.0% |
| Spanish | 0.1 /100 | #277 | Tragic 13.0% |
| Scottish | 0.1 /100 | #278 | Tragic 13.0% |
| Arapaho | 0.1 /100 | #279 | Tragic 13.0% |
| Irish | 0.1 /100 | #280 | Tragic 13.1% |
| U.S. Virgin Islanders | 0.1 /100 | #281 | Tragic 13.1% |
| Welsh | 0.0 /100 | #282 | Tragic 13.1% |
| English | 0.0 /100 | #283 | Tragic 13.1% |
| Hmong | 0.0 /100 | #284 | Tragic 13.1% |
| Bangladeshis | 0.0 /100 | #285 | Tragic 13.1% |
| Fijians | 0.0 /100 | #286 | Tragic 13.1% |
Demographics Similar to Bhutanese by Female Disability
In terms of female disability, the demographic groups most similar to Bhutanese are Immigrants from Switzerland (11.5%, a difference of 0.080%), Chilean (11.5%, a difference of 0.090%), Immigrants from Lebanon (11.5%, a difference of 0.12%), Immigrants from Eritrea (11.5%, a difference of 0.15%), and Immigrants from Afghanistan (11.5%, a difference of 0.15%).
| Demographics | Rating | Rank | Female Disability |
| Immigrants | Vietnam | 99.8 /100 | #67 | Exceptional 11.5% |
| Immigrants | Northern Africa | 99.8 /100 | #68 | Exceptional 11.5% |
| Colombians | 99.8 /100 | #69 | Exceptional 11.5% |
| Immigrants | Chile | 99.8 /100 | #70 | Exceptional 11.5% |
| Immigrants | Ireland | 99.8 /100 | #71 | Exceptional 11.5% |
| Chileans | 99.8 /100 | #72 | Exceptional 11.5% |
| Immigrants | Switzerland | 99.8 /100 | #73 | Exceptional 11.5% |
| Bhutanese | 99.8 /100 | #74 | Exceptional 11.5% |
| Immigrants | Lebanon | 99.7 /100 | #75 | Exceptional 11.5% |
| Immigrants | Eritrea | 99.7 /100 | #76 | Exceptional 11.5% |
| Immigrants | Afghanistan | 99.7 /100 | #77 | Exceptional 11.5% |
| Immigrants | South Africa | 99.7 /100 | #78 | Exceptional 11.5% |
| Sierra Leoneans | 99.7 /100 | #79 | Exceptional 11.5% |
| Immigrants | Jordan | 99.7 /100 | #80 | Exceptional 11.5% |
| Eastern Europeans | 99.7 /100 | #81 | Exceptional 11.5% |