Nicaraguan vs Lumbee Disability Age 65 to 74
COMPARE
Nicaraguan
Lumbee
Disability Age 65 to 74
Disability Age 65 to 74 Comparison
Nicaraguans
Lumbee
23.9%
DISABILITY AGE 65 TO 74
14.3/ 100
METRIC RATING
213th/ 347
METRIC RANK
32.7%
DISABILITY AGE 65 TO 74
0.0/ 100
METRIC RATING
340th/ 347
METRIC RANK
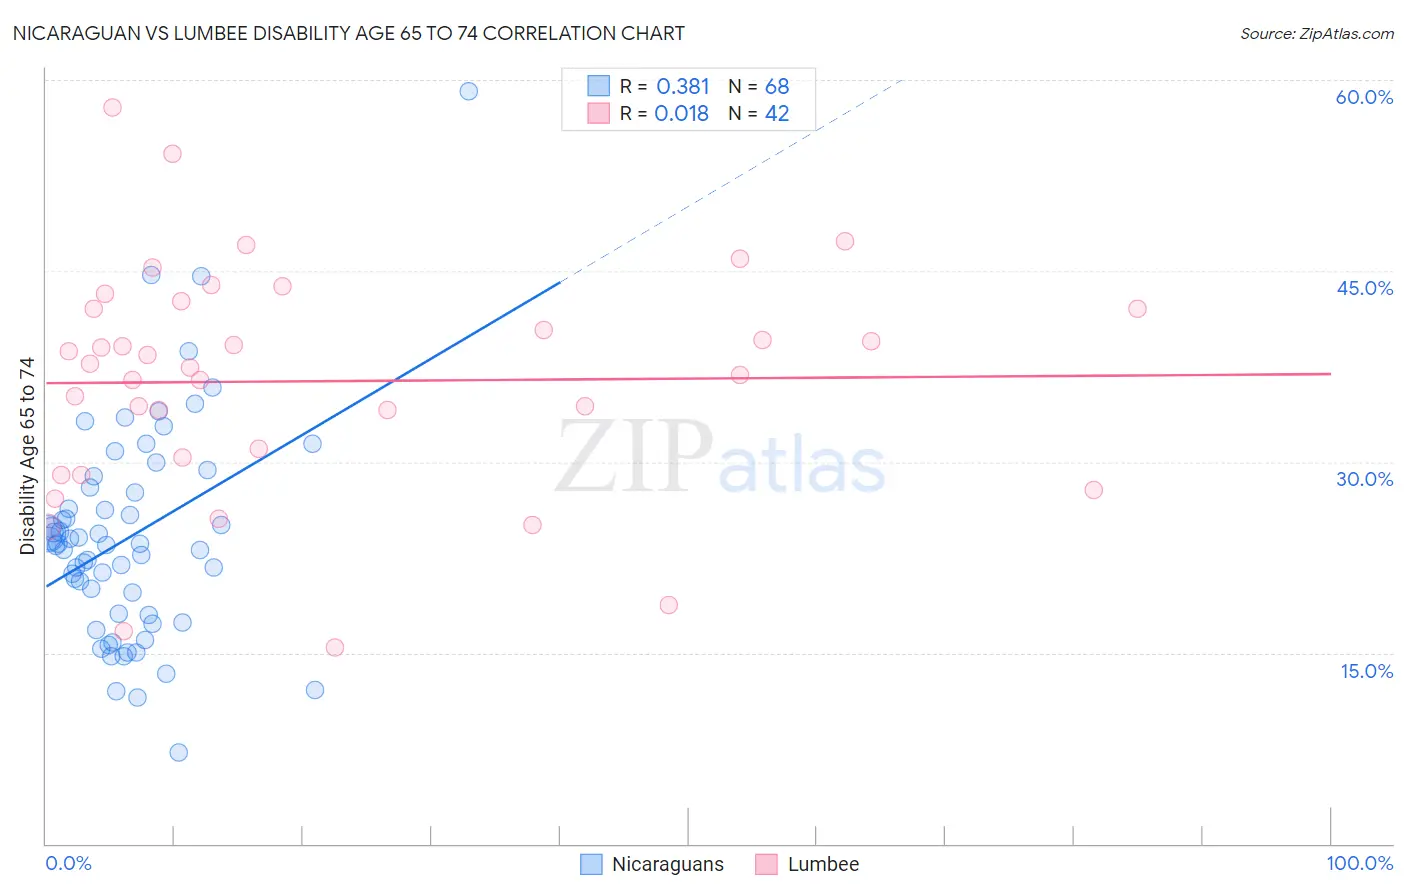
Nicaraguan vs Lumbee Disability Age 65 to 74 Correlation Chart
The statistical analysis conducted on geographies consisting of 285,318,687 people shows a mild positive correlation between the proportion of Nicaraguans and percentage of population with a disability between the ages 65 and 75 in the United States with a correlation coefficient (R) of 0.381 and weighted average of 23.9%. Similarly, the statistical analysis conducted on geographies consisting of 92,106,764 people shows no correlation between the proportion of Lumbee and percentage of population with a disability between the ages 65 and 75 in the United States with a correlation coefficient (R) of 0.018 and weighted average of 32.7%, a difference of 36.6%.
Disability Age 65 to 74 Correlation Summary
| Measurement | Nicaraguan | Lumbee |
| Minimum | 7.2% | 15.4% |
| Maximum | 59.1% | 57.9% |
| Range | 52.0% | 42.5% |
| Mean | 24.1% | 36.3% |
| Median | 23.5% | 37.5% |
| Interquartile 25% (IQ1) | 18.0% | 30.3% |
| Interquartile 75% (IQ3) | 27.8% | 42.0% |
| Interquartile Range (IQR) | 9.8% | 11.7% |
| Standard Deviation (Sample) | 8.6% | 9.1% |
| Standard Deviation (Population) | 8.5% | 9.0% |
Similar Demographics by Disability Age 65 to 74
Demographics Similar to Nicaraguans by Disability Age 65 to 74
In terms of disability age 65 to 74, the demographic groups most similar to Nicaraguans are Immigrants from Oceania (24.0%, a difference of 0.080%), Pennsylvania German (24.0%, a difference of 0.12%), French (23.9%, a difference of 0.16%), Immigrants from West Indies (23.9%, a difference of 0.19%), and Trinidadian and Tobagonian (23.9%, a difference of 0.23%).
| Demographics | Rating | Rank | Disability Age 65 to 74 |
| Immigrants | Jamaica | 20.7 /100 | #206 | Fair 23.8% |
| Immigrants | Sudan | 20.1 /100 | #207 | Fair 23.8% |
| Immigrants | Barbados | 19.6 /100 | #208 | Poor 23.8% |
| Immigrants | Kenya | 19.6 /100 | #209 | Poor 23.8% |
| Trinidadians and Tobagonians | 16.4 /100 | #210 | Poor 23.9% |
| Immigrants | West Indies | 15.9 /100 | #211 | Poor 23.9% |
| French | 15.7 /100 | #212 | Poor 23.9% |
| Nicaraguans | 14.3 /100 | #213 | Poor 23.9% |
| Immigrants | Oceania | 13.6 /100 | #214 | Poor 24.0% |
| Pennsylvania Germans | 13.3 /100 | #215 | Poor 24.0% |
| Jamaicans | 12.2 /100 | #216 | Poor 24.0% |
| Immigrants | Portugal | 11.7 /100 | #217 | Poor 24.0% |
| Immigrants | Nigeria | 11.7 /100 | #218 | Poor 24.0% |
| Immigrants | Burma/Myanmar | 11.6 /100 | #219 | Poor 24.0% |
| Ghanaians | 10.4 /100 | #220 | Poor 24.1% |
Demographics Similar to Lumbee by Disability Age 65 to 74
In terms of disability age 65 to 74, the demographic groups most similar to Lumbee are Kiowa (32.6%, a difference of 0.52%), Tsimshian (32.9%, a difference of 0.53%), Pueblo (33.1%, a difference of 1.1%), Alaskan Athabascan (32.4%, a difference of 1.1%), and Houma (32.3%, a difference of 1.3%).
| Demographics | Rating | Rank | Disability Age 65 to 74 |
| Colville | 0.0 /100 | #333 | Tragic 30.5% |
| Alaska Natives | 0.0 /100 | #334 | Tragic 30.6% |
| Cheyenne | 0.0 /100 | #335 | Tragic 31.1% |
| Yuman | 0.0 /100 | #336 | Tragic 31.5% |
| Houma | 0.0 /100 | #337 | Tragic 32.3% |
| Alaskan Athabascans | 0.0 /100 | #338 | Tragic 32.4% |
| Kiowa | 0.0 /100 | #339 | Tragic 32.6% |
| Lumbee | 0.0 /100 | #340 | Tragic 32.7% |
| Tsimshian | 0.0 /100 | #341 | Tragic 32.9% |
| Pueblo | 0.0 /100 | #342 | Tragic 33.1% |
| Navajo | 0.0 /100 | #343 | Tragic 33.3% |
| Inupiat | 0.0 /100 | #344 | Tragic 34.5% |
| Tohono O'odham | 0.0 /100 | #345 | Tragic 36.0% |
| Yup'ik | 0.0 /100 | #346 | Tragic 37.8% |
| Pima | 0.0 /100 | #347 | Tragic 38.6% |