Nicaraguan vs Sudanese Disability Age 65 to 74
COMPARE
Nicaraguan
Sudanese
Disability Age 65 to 74
Disability Age 65 to 74 Comparison
Nicaraguans
Sudanese
23.9%
DISABILITY AGE 65 TO 74
14.3/ 100
METRIC RATING
213th/ 347
METRIC RANK
23.7%
DISABILITY AGE 65 TO 74
27.8/ 100
METRIC RATING
194th/ 347
METRIC RANK
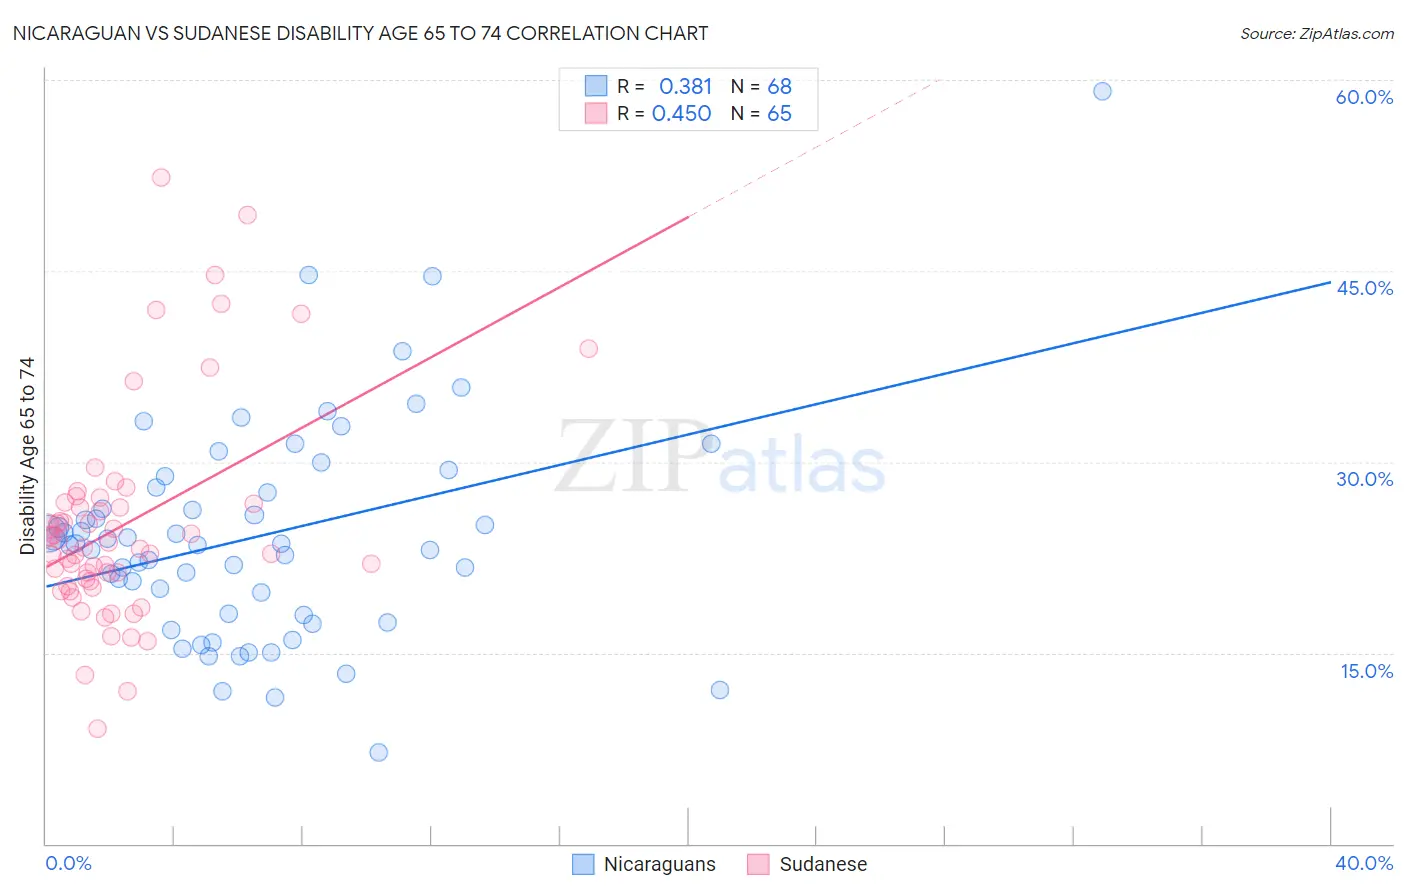
Nicaraguan vs Sudanese Disability Age 65 to 74 Correlation Chart
The statistical analysis conducted on geographies consisting of 285,318,687 people shows a mild positive correlation between the proportion of Nicaraguans and percentage of population with a disability between the ages 65 and 75 in the United States with a correlation coefficient (R) of 0.381 and weighted average of 23.9%. Similarly, the statistical analysis conducted on geographies consisting of 110,017,591 people shows a moderate positive correlation between the proportion of Sudanese and percentage of population with a disability between the ages 65 and 75 in the United States with a correlation coefficient (R) of 0.450 and weighted average of 23.7%, a difference of 1.2%.
Disability Age 65 to 74 Correlation Summary
| Measurement | Nicaraguan | Sudanese |
| Minimum | 7.2% | 9.1% |
| Maximum | 59.1% | 52.4% |
| Range | 52.0% | 43.3% |
| Mean | 24.1% | 25.0% |
| Median | 23.5% | 23.3% |
| Interquartile 25% (IQ1) | 18.0% | 20.4% |
| Interquartile 75% (IQ3) | 27.8% | 26.8% |
| Interquartile Range (IQR) | 9.8% | 6.4% |
| Standard Deviation (Sample) | 8.6% | 8.4% |
| Standard Deviation (Population) | 8.5% | 8.3% |
Demographics Similar to Nicaraguans and Sudanese by Disability Age 65 to 74
In terms of disability age 65 to 74, the demographic groups most similar to Nicaraguans are French (23.9%, a difference of 0.16%), Immigrants from West Indies (23.9%, a difference of 0.19%), Trinidadian and Tobagonian (23.9%, a difference of 0.23%), Immigrants from Barbados (23.8%, a difference of 0.54%), and Immigrants from Kenya (23.8%, a difference of 0.54%). Similarly, the demographic groups most similar to Sudanese are English (23.6%, a difference of 0.050%), Immigrants from St. Vincent and the Grenadines (23.7%, a difference of 0.13%), Immigrants from Trinidad and Tobago (23.7%, a difference of 0.13%), Immigrants (23.7%, a difference of 0.15%), and Immigrants from Africa (23.7%, a difference of 0.25%).
| Demographics | Rating | Rank | Disability Age 65 to 74 |
| English | 28.5 /100 | #193 | Fair 23.6% |
| Sudanese | 27.8 /100 | #194 | Fair 23.7% |
| Immigrants | St. Vincent and the Grenadines | 26.1 /100 | #195 | Fair 23.7% |
| Immigrants | Trinidad and Tobago | 26.1 /100 | #196 | Fair 23.7% |
| Immigrants | Immigrants | 25.8 /100 | #197 | Fair 23.7% |
| Immigrants | Africa | 24.4 /100 | #198 | Fair 23.7% |
| Welsh | 24.3 /100 | #199 | Fair 23.7% |
| French Canadians | 24.0 /100 | #200 | Fair 23.7% |
| Immigrants | Ecuador | 23.9 /100 | #201 | Fair 23.7% |
| Immigrants | Bahamas | 23.3 /100 | #202 | Fair 23.7% |
| Kenyans | 23.2 /100 | #203 | Fair 23.7% |
| Immigrants | Grenada | 22.1 /100 | #204 | Fair 23.8% |
| Tongans | 20.8 /100 | #205 | Fair 23.8% |
| Immigrants | Jamaica | 20.7 /100 | #206 | Fair 23.8% |
| Immigrants | Sudan | 20.1 /100 | #207 | Fair 23.8% |
| Immigrants | Barbados | 19.6 /100 | #208 | Poor 23.8% |
| Immigrants | Kenya | 19.6 /100 | #209 | Poor 23.8% |
| Trinidadians and Tobagonians | 16.4 /100 | #210 | Poor 23.9% |
| Immigrants | West Indies | 15.9 /100 | #211 | Poor 23.9% |
| French | 15.7 /100 | #212 | Poor 23.9% |
| Nicaraguans | 14.3 /100 | #213 | Poor 23.9% |