Nicaraguan vs Bahamian Vision Disability
COMPARE
Nicaraguan
Bahamian
Vision Disability
Vision Disability Comparison
Nicaraguans
Bahamians
2.3%
VISION DISABILITY
2.2/ 100
METRIC RATING
230th/ 347
METRIC RANK
2.4%
VISION DISABILITY
0.0/ 100
METRIC RATING
277th/ 347
METRIC RANK
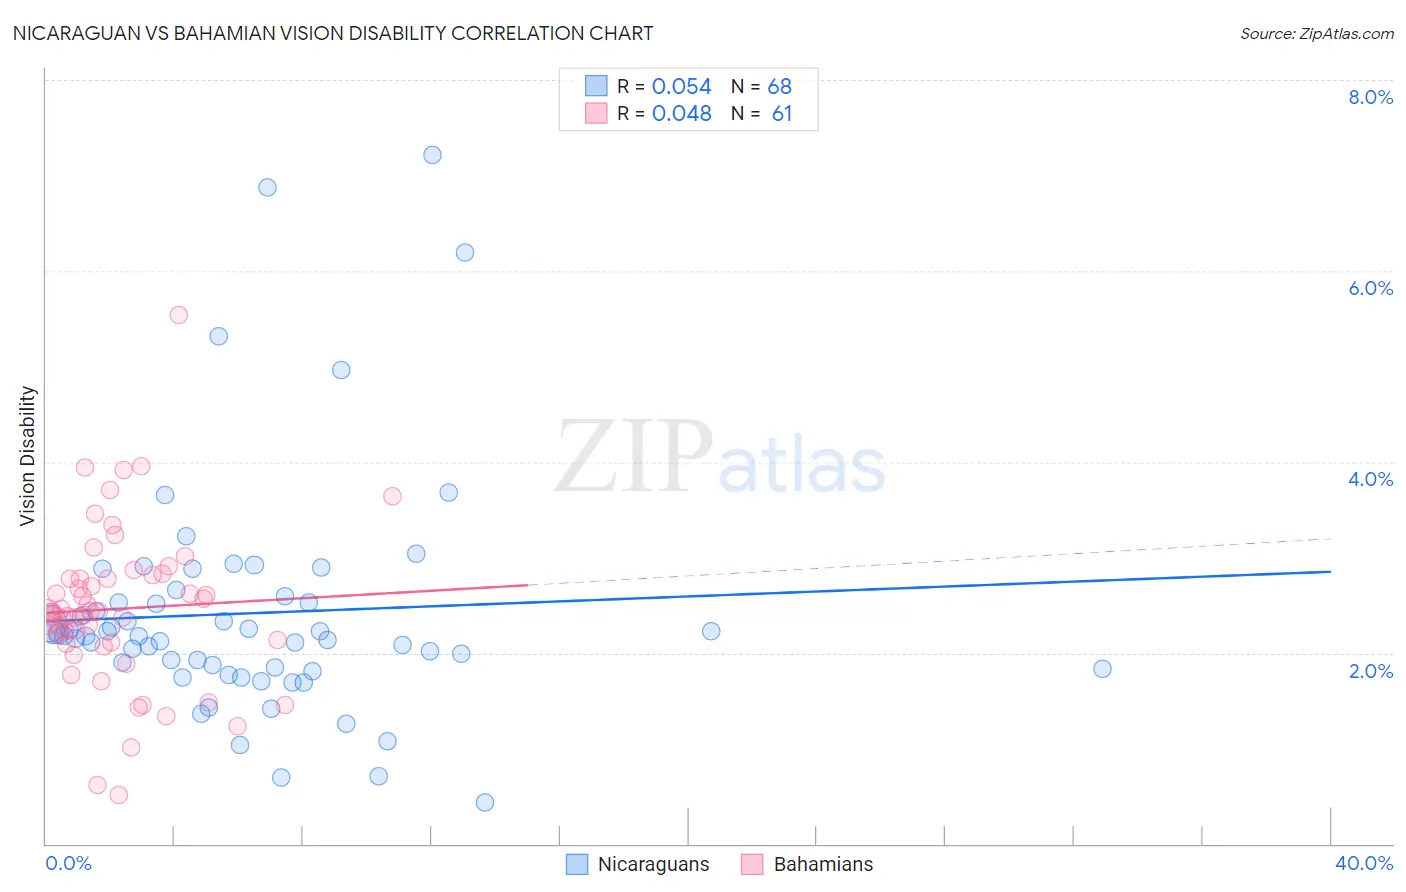
Nicaraguan vs Bahamian Vision Disability Correlation Chart
The statistical analysis conducted on geographies consisting of 285,594,144 people shows a slight positive correlation between the proportion of Nicaraguans and percentage of population with vision disability in the United States with a correlation coefficient (R) of 0.054 and weighted average of 2.3%. Similarly, the statistical analysis conducted on geographies consisting of 112,669,490 people shows no correlation between the proportion of Bahamians and percentage of population with vision disability in the United States with a correlation coefficient (R) of 0.048 and weighted average of 2.4%, a difference of 6.4%.
Vision Disability Correlation Summary
| Measurement | Nicaraguan | Bahamian |
| Minimum | 0.44% | 0.51% |
| Maximum | 7.2% | 5.5% |
| Range | 6.8% | 5.0% |
| Mean | 2.4% | 2.5% |
| Median | 2.2% | 2.4% |
| Interquartile 25% (IQ1) | 1.8% | 2.1% |
| Interquartile 75% (IQ3) | 2.6% | 2.8% |
| Interquartile Range (IQR) | 0.73% | 0.69% |
| Standard Deviation (Sample) | 1.2% | 0.83% |
| Standard Deviation (Population) | 1.2% | 0.83% |
Similar Demographics by Vision Disability
Demographics Similar to Nicaraguans by Vision Disability
In terms of vision disability, the demographic groups most similar to Nicaraguans are Welsh (2.3%, a difference of 0.070%), Hmong (2.3%, a difference of 0.15%), Immigrants from Ecuador (2.3%, a difference of 0.16%), German Russian (2.3%, a difference of 0.35%), and Central American (2.3%, a difference of 0.36%).
| Demographics | Rating | Rank | Vision Disability |
| Basques | 3.5 /100 | #223 | Tragic 2.3% |
| Irish | 3.4 /100 | #224 | Tragic 2.3% |
| Immigrants | Western Africa | 3.4 /100 | #225 | Tragic 2.3% |
| Immigrants | Germany | 3.0 /100 | #226 | Tragic 2.3% |
| Hawaiians | 2.9 /100 | #227 | Tragic 2.3% |
| Hmong | 2.5 /100 | #228 | Tragic 2.3% |
| Welsh | 2.3 /100 | #229 | Tragic 2.3% |
| Nicaraguans | 2.2 /100 | #230 | Tragic 2.3% |
| Immigrants | Ecuador | 2.0 /100 | #231 | Tragic 2.3% |
| German Russians | 1.8 /100 | #232 | Tragic 2.3% |
| Central Americans | 1.8 /100 | #233 | Tragic 2.3% |
| Scottish | 1.6 /100 | #234 | Tragic 2.3% |
| Marshallese | 1.5 /100 | #235 | Tragic 2.3% |
| Immigrants | Congo | 1.4 /100 | #236 | Tragic 2.3% |
| Immigrants | Portugal | 1.4 /100 | #237 | Tragic 2.3% |
Demographics Similar to Bahamians by Vision Disability
In terms of vision disability, the demographic groups most similar to Bahamians are Scotch-Irish (2.4%, a difference of 0.040%), Chippewa (2.4%, a difference of 0.13%), Spanish (2.4%, a difference of 0.16%), Nepalese (2.4%, a difference of 0.17%), and Cape Verdean (2.4%, a difference of 0.21%).
| Demographics | Rating | Rank | Vision Disability |
| Cubans | 0.1 /100 | #270 | Tragic 2.4% |
| Immigrants | Azores | 0.1 /100 | #271 | Tragic 2.4% |
| Spaniards | 0.1 /100 | #272 | Tragic 2.4% |
| Immigrants | Bahamas | 0.1 /100 | #273 | Tragic 2.4% |
| Immigrants | Latin America | 0.0 /100 | #274 | Tragic 2.4% |
| Chippewa | 0.0 /100 | #275 | Tragic 2.4% |
| Scotch-Irish | 0.0 /100 | #276 | Tragic 2.4% |
| Bahamians | 0.0 /100 | #277 | Tragic 2.4% |
| Spanish | 0.0 /100 | #278 | Tragic 2.4% |
| Nepalese | 0.0 /100 | #279 | Tragic 2.4% |
| Cape Verdeans | 0.0 /100 | #280 | Tragic 2.4% |
| U.S. Virgin Islanders | 0.0 /100 | #281 | Tragic 2.5% |
| Immigrants | Caribbean | 0.0 /100 | #282 | Tragic 2.5% |
| Puget Sound Salish | 0.0 /100 | #283 | Tragic 2.5% |
| Yakama | 0.0 /100 | #284 | Tragic 2.5% |