Immigrants from Korea vs Tohono O'odham Vision Disability
COMPARE
Immigrants from Korea
Tohono O'odham
Vision Disability
Vision Disability Comparison
Immigrants from Korea
Tohono O'odham
1.8%
VISION DISABILITY
100.0/ 100
METRIC RATING
12th/ 347
METRIC RANK
2.8%
VISION DISABILITY
0.0/ 100
METRIC RATING
319th/ 347
METRIC RANK
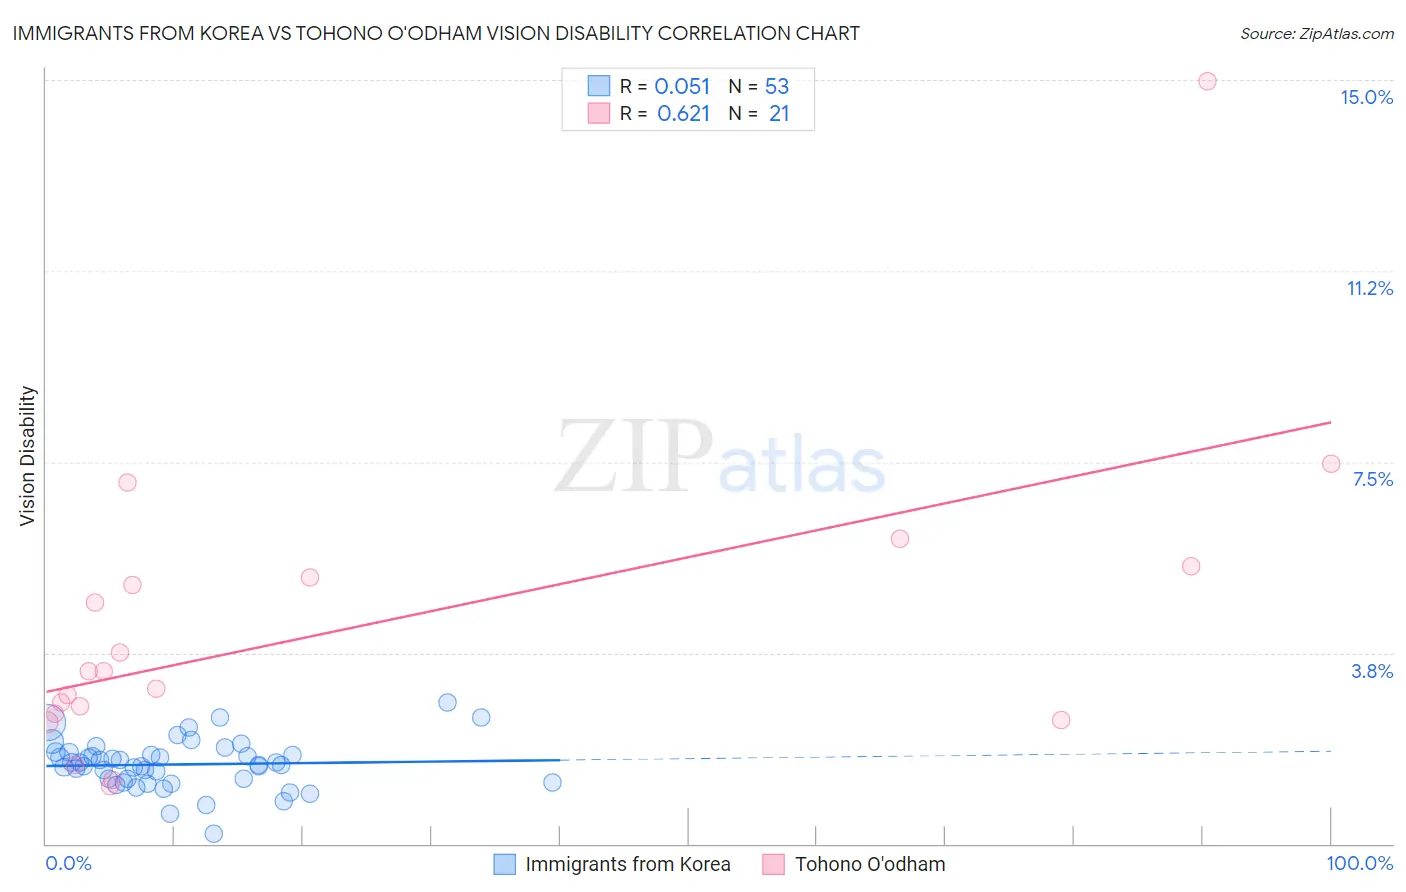
Immigrants from Korea vs Tohono O'odham Vision Disability Correlation Chart
The statistical analysis conducted on geographies consisting of 415,890,370 people shows a slight positive correlation between the proportion of Immigrants from Korea and percentage of population with vision disability in the United States with a correlation coefficient (R) of 0.051 and weighted average of 1.8%. Similarly, the statistical analysis conducted on geographies consisting of 58,710,192 people shows a significant positive correlation between the proportion of Tohono O'odham and percentage of population with vision disability in the United States with a correlation coefficient (R) of 0.621 and weighted average of 2.8%, a difference of 51.2%.
Vision Disability Correlation Summary
| Measurement | Immigrants from Korea | Tohono O'odham |
| Minimum | 0.21% | 1.1% |
| Maximum | 2.8% | 15.0% |
| Range | 2.6% | 13.8% |
| Mean | 1.6% | 4.2% |
| Median | 1.5% | 3.4% |
| Interquartile 25% (IQ1) | 1.2% | 2.5% |
| Interquartile 75% (IQ3) | 1.8% | 5.3% |
| Interquartile Range (IQR) | 0.53% | 2.8% |
| Standard Deviation (Sample) | 0.48% | 3.0% |
| Standard Deviation (Population) | 0.47% | 3.0% |
Similar Demographics by Vision Disability
Demographics Similar to Immigrants from Korea by Vision Disability
In terms of vision disability, the demographic groups most similar to Immigrants from Korea are Immigrants from Eastern Asia (1.8%, a difference of 0.080%), Immigrants from China (1.8%, a difference of 0.22%), Immigrants from Israel (1.8%, a difference of 0.23%), Immigrants from Bolivia (1.8%, a difference of 0.65%), and Indian (Asian) (1.8%, a difference of 1.1%).
| Demographics | Rating | Rank | Vision Disability |
| Okinawans | 100.0 /100 | #5 | Exceptional 1.8% |
| Immigrants | Iran | 100.0 /100 | #6 | Exceptional 1.8% |
| Immigrants | South Central Asia | 100.0 /100 | #7 | Exceptional 1.8% |
| Iranians | 100.0 /100 | #8 | Exceptional 1.8% |
| Immigrants | Singapore | 100.0 /100 | #9 | Exceptional 1.8% |
| Immigrants | Hong Kong | 100.0 /100 | #10 | Exceptional 1.8% |
| Immigrants | Israel | 100.0 /100 | #11 | Exceptional 1.8% |
| Immigrants | Korea | 100.0 /100 | #12 | Exceptional 1.8% |
| Immigrants | Eastern Asia | 100.0 /100 | #13 | Exceptional 1.8% |
| Immigrants | China | 100.0 /100 | #14 | Exceptional 1.8% |
| Immigrants | Bolivia | 100.0 /100 | #15 | Exceptional 1.8% |
| Indians (Asian) | 100.0 /100 | #16 | Exceptional 1.8% |
| Burmese | 100.0 /100 | #17 | Exceptional 1.8% |
| Bolivians | 100.0 /100 | #18 | Exceptional 1.9% |
| Immigrants | Sri Lanka | 100.0 /100 | #19 | Exceptional 1.9% |
Demographics Similar to Tohono O'odham by Vision Disability
In terms of vision disability, the demographic groups most similar to Tohono O'odham are Black/African American (2.8%, a difference of 0.69%), Alaska Native (2.7%, a difference of 1.4%), Yup'ik (2.7%, a difference of 2.5%), Comanche (2.8%, a difference of 2.7%), and Shoshone (2.7%, a difference of 2.7%).
| Demographics | Rating | Rank | Vision Disability |
| Americans | 0.0 /100 | #312 | Tragic 2.6% |
| Potawatomi | 0.0 /100 | #313 | Tragic 2.6% |
| Inupiat | 0.0 /100 | #314 | Tragic 2.7% |
| Osage | 0.0 /100 | #315 | Tragic 2.7% |
| Shoshone | 0.0 /100 | #316 | Tragic 2.7% |
| Yup'ik | 0.0 /100 | #317 | Tragic 2.7% |
| Alaska Natives | 0.0 /100 | #318 | Tragic 2.7% |
| Tohono O'odham | 0.0 /100 | #319 | Tragic 2.8% |
| Blacks/African Americans | 0.0 /100 | #320 | Tragic 2.8% |
| Comanche | 0.0 /100 | #321 | Tragic 2.8% |
| Paiute | 0.0 /100 | #322 | Tragic 2.9% |
| Tlingit-Haida | 0.0 /100 | #323 | Tragic 2.9% |
| Hopi | 0.0 /100 | #324 | Tragic 2.9% |
| Cherokee | 0.0 /100 | #325 | Tragic 2.9% |
| Spanish Americans | 0.0 /100 | #326 | Tragic 2.9% |