Nepalese vs Immigrants from Fiji Cognitive Disability
COMPARE
Nepalese
Immigrants from Fiji
Cognitive Disability
Cognitive Disability Comparison
Nepalese
Immigrants from Fiji
18.0%
COGNITIVE DISABILITY
0.3/ 100
METRIC RATING
267th/ 347
METRIC RANK
17.4%
COGNITIVE DISABILITY
33.7/ 100
METRIC RATING
187th/ 347
METRIC RANK
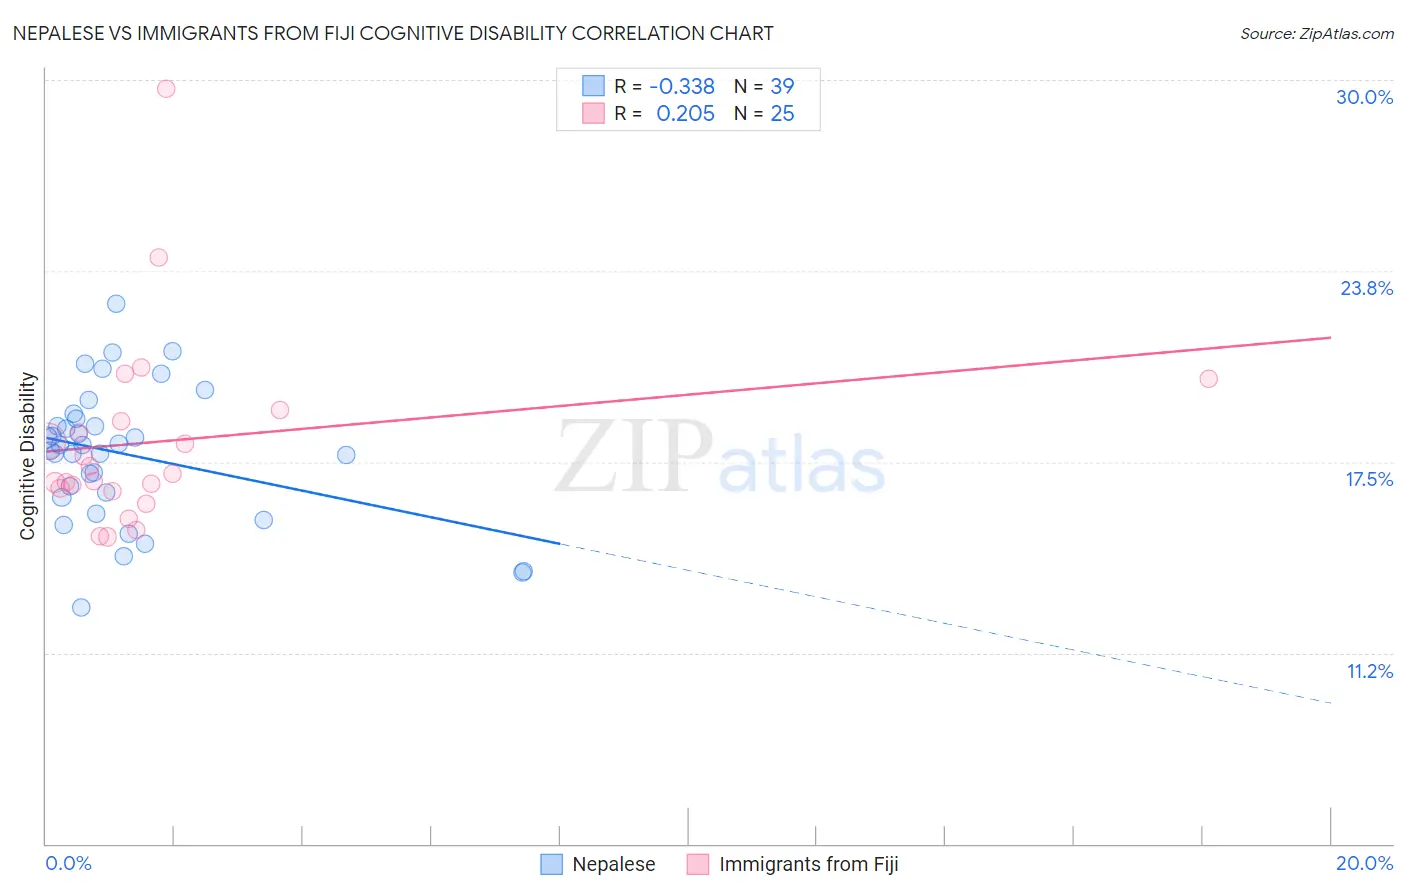
Nepalese vs Immigrants from Fiji Cognitive Disability Correlation Chart
The statistical analysis conducted on geographies consisting of 24,519,269 people shows a mild negative correlation between the proportion of Nepalese and percentage of population with cognitive disability in the United States with a correlation coefficient (R) of -0.338 and weighted average of 18.0%. Similarly, the statistical analysis conducted on geographies consisting of 93,755,380 people shows a weak positive correlation between the proportion of Immigrants from Fiji and percentage of population with cognitive disability in the United States with a correlation coefficient (R) of 0.205 and weighted average of 17.4%, a difference of 3.5%.
Cognitive Disability Correlation Summary
| Measurement | Nepalese | Immigrants from Fiji |
| Minimum | 12.7% | 15.0% |
| Maximum | 22.7% | 29.7% |
| Range | 10.0% | 14.7% |
| Mean | 17.7% | 18.2% |
| Median | 18.0% | 17.1% |
| Interquartile 25% (IQ1) | 16.4% | 16.6% |
| Interquartile 75% (IQ3) | 18.9% | 19.0% |
| Interquartile Range (IQR) | 2.6% | 2.4% |
| Standard Deviation (Sample) | 2.2% | 3.2% |
| Standard Deviation (Population) | 2.2% | 3.1% |
Similar Demographics by Cognitive Disability
Demographics Similar to Nepalese by Cognitive Disability
In terms of cognitive disability, the demographic groups most similar to Nepalese are Cherokee (18.0%, a difference of 0.010%), Spanish American (18.0%, a difference of 0.060%), Belizean (18.0%, a difference of 0.060%), Menominee (18.0%, a difference of 0.090%), and Immigrants from Barbados (17.9%, a difference of 0.15%).
| Demographics | Rating | Rank | Cognitive Disability |
| Immigrants | Belize | 0.5 /100 | #260 | Tragic 17.9% |
| Guamanians/Chamorros | 0.5 /100 | #261 | Tragic 17.9% |
| Sierra Leoneans | 0.4 /100 | #262 | Tragic 17.9% |
| Immigrants | Barbados | 0.4 /100 | #263 | Tragic 17.9% |
| Menominee | 0.4 /100 | #264 | Tragic 18.0% |
| Spanish Americans | 0.4 /100 | #265 | Tragic 18.0% |
| Belizeans | 0.4 /100 | #266 | Tragic 18.0% |
| Nepalese | 0.3 /100 | #267 | Tragic 18.0% |
| Cherokee | 0.3 /100 | #268 | Tragic 18.0% |
| Hondurans | 0.3 /100 | #269 | Tragic 18.0% |
| Immigrants | Bahamas | 0.3 /100 | #270 | Tragic 18.0% |
| Potawatomi | 0.2 /100 | #271 | Tragic 18.0% |
| Immigrants | Honduras | 0.2 /100 | #272 | Tragic 18.0% |
| Immigrants | Nepal | 0.2 /100 | #273 | Tragic 18.0% |
| Immigrants | Nigeria | 0.2 /100 | #274 | Tragic 18.0% |
Demographics Similar to Immigrants from Fiji by Cognitive Disability
In terms of cognitive disability, the demographic groups most similar to Immigrants from Fiji are Cambodian (17.3%, a difference of 0.070%), Immigrants from France (17.4%, a difference of 0.13%), Afghan (17.3%, a difference of 0.14%), Immigrants from Western Asia (17.4%, a difference of 0.14%), and Crow (17.3%, a difference of 0.17%).
| Demographics | Rating | Rank | Cognitive Disability |
| Pakistanis | 43.9 /100 | #180 | Average 17.3% |
| Immigrants | Guyana | 42.9 /100 | #181 | Average 17.3% |
| Arabs | 42.8 /100 | #182 | Average 17.3% |
| Spaniards | 40.3 /100 | #183 | Average 17.3% |
| Crow | 39.1 /100 | #184 | Fair 17.3% |
| Afghans | 38.2 /100 | #185 | Fair 17.3% |
| Cambodians | 35.9 /100 | #186 | Fair 17.3% |
| Immigrants | Fiji | 33.7 /100 | #187 | Fair 17.4% |
| Immigrants | France | 29.8 /100 | #188 | Fair 17.4% |
| Immigrants | Western Asia | 29.5 /100 | #189 | Fair 17.4% |
| Immigrants | Spain | 27.7 /100 | #190 | Fair 17.4% |
| Immigrants | Nonimmigrants | 27.4 /100 | #191 | Fair 17.4% |
| Immigrants | Haiti | 27.1 /100 | #192 | Fair 17.4% |
| Delaware | 25.6 /100 | #193 | Fair 17.4% |
| Immigrants | Bosnia and Herzegovina | 22.0 /100 | #194 | Fair 17.4% |