Immigrants from Eastern Africa vs Immigrants from Fiji Cognitive Disability
COMPARE
Immigrants from Eastern Africa
Immigrants from Fiji
Cognitive Disability
Cognitive Disability Comparison
Immigrants from Eastern Africa
Immigrants from Fiji
18.4%
COGNITIVE DISABILITY
0.0/ 100
METRIC RATING
309th/ 347
METRIC RANK
17.4%
COGNITIVE DISABILITY
33.7/ 100
METRIC RATING
187th/ 347
METRIC RANK
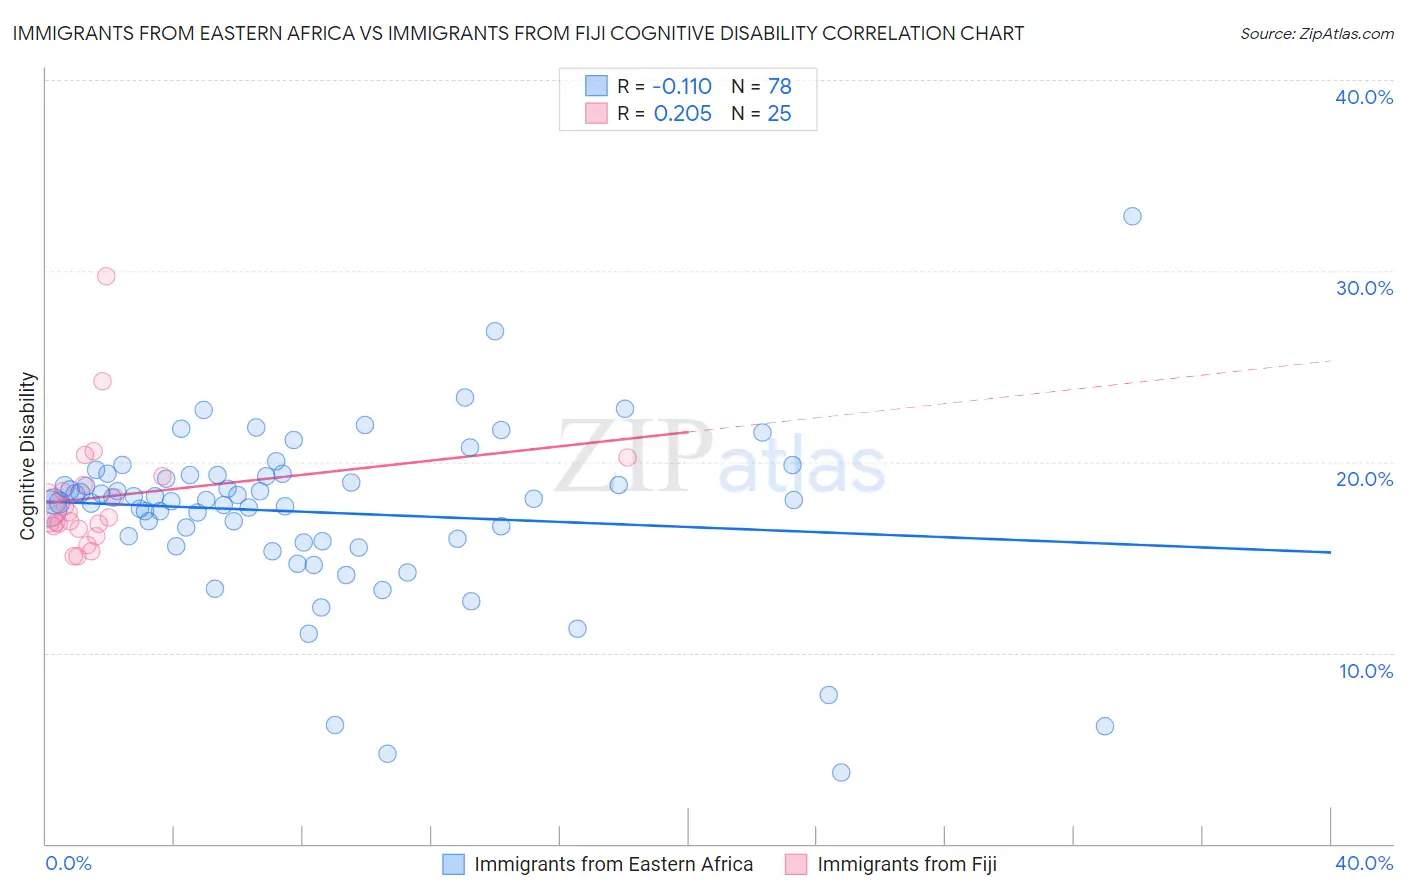
Immigrants from Eastern Africa vs Immigrants from Fiji Cognitive Disability Correlation Chart
The statistical analysis conducted on geographies consisting of 355,111,422 people shows a poor negative correlation between the proportion of Immigrants from Eastern Africa and percentage of population with cognitive disability in the United States with a correlation coefficient (R) of -0.110 and weighted average of 18.4%. Similarly, the statistical analysis conducted on geographies consisting of 93,755,380 people shows a weak positive correlation between the proportion of Immigrants from Fiji and percentage of population with cognitive disability in the United States with a correlation coefficient (R) of 0.205 and weighted average of 17.4%, a difference of 5.8%.
Cognitive Disability Correlation Summary
| Measurement | Immigrants from Eastern Africa | Immigrants from Fiji |
| Minimum | 3.7% | 15.0% |
| Maximum | 32.8% | 29.7% |
| Range | 29.1% | 14.7% |
| Mean | 17.4% | 18.2% |
| Median | 18.0% | 17.1% |
| Interquartile 25% (IQ1) | 15.9% | 16.6% |
| Interquartile 75% (IQ3) | 19.3% | 19.0% |
| Interquartile Range (IQR) | 3.4% | 2.4% |
| Standard Deviation (Sample) | 4.4% | 3.2% |
| Standard Deviation (Population) | 4.4% | 3.1% |
Similar Demographics by Cognitive Disability
Demographics Similar to Immigrants from Eastern Africa by Cognitive Disability
In terms of cognitive disability, the demographic groups most similar to Immigrants from Eastern Africa are Immigrants from Western Africa (18.4%, a difference of 0.040%), Ugandan (18.3%, a difference of 0.12%), Seminole (18.3%, a difference of 0.13%), Colville (18.3%, a difference of 0.14%), and Immigrants from Eritrea (18.3%, a difference of 0.25%).
| Demographics | Rating | Rank | Cognitive Disability |
| Barbadians | 0.0 /100 | #302 | Tragic 18.3% |
| Immigrants | Kenya | 0.0 /100 | #303 | Tragic 18.3% |
| Immigrants | Eritrea | 0.0 /100 | #304 | Tragic 18.3% |
| Colville | 0.0 /100 | #305 | Tragic 18.3% |
| Seminole | 0.0 /100 | #306 | Tragic 18.3% |
| Ugandans | 0.0 /100 | #307 | Tragic 18.3% |
| Immigrants | Western Africa | 0.0 /100 | #308 | Tragic 18.4% |
| Immigrants | Eastern Africa | 0.0 /100 | #309 | Tragic 18.4% |
| Choctaw | 0.0 /100 | #310 | Tragic 18.4% |
| Hmong | 0.0 /100 | #311 | Tragic 18.4% |
| Chickasaw | 0.0 /100 | #312 | Tragic 18.5% |
| Yaqui | 0.0 /100 | #313 | Tragic 18.5% |
| Sub-Saharan Africans | 0.0 /100 | #314 | Tragic 18.5% |
| Immigrants | Dominica | 0.0 /100 | #315 | Tragic 18.6% |
| Immigrants | Middle Africa | 0.0 /100 | #316 | Tragic 18.6% |
Demographics Similar to Immigrants from Fiji by Cognitive Disability
In terms of cognitive disability, the demographic groups most similar to Immigrants from Fiji are Cambodian (17.3%, a difference of 0.070%), Immigrants from France (17.4%, a difference of 0.13%), Afghan (17.3%, a difference of 0.14%), Immigrants from Western Asia (17.4%, a difference of 0.14%), and Crow (17.3%, a difference of 0.17%).
| Demographics | Rating | Rank | Cognitive Disability |
| Pakistanis | 43.9 /100 | #180 | Average 17.3% |
| Immigrants | Guyana | 42.9 /100 | #181 | Average 17.3% |
| Arabs | 42.8 /100 | #182 | Average 17.3% |
| Spaniards | 40.3 /100 | #183 | Average 17.3% |
| Crow | 39.1 /100 | #184 | Fair 17.3% |
| Afghans | 38.2 /100 | #185 | Fair 17.3% |
| Cambodians | 35.9 /100 | #186 | Fair 17.3% |
| Immigrants | Fiji | 33.7 /100 | #187 | Fair 17.4% |
| Immigrants | France | 29.8 /100 | #188 | Fair 17.4% |
| Immigrants | Western Asia | 29.5 /100 | #189 | Fair 17.4% |
| Immigrants | Spain | 27.7 /100 | #190 | Fair 17.4% |
| Immigrants | Nonimmigrants | 27.4 /100 | #191 | Fair 17.4% |
| Immigrants | Haiti | 27.1 /100 | #192 | Fair 17.4% |
| Delaware | 25.6 /100 | #193 | Fair 17.4% |
| Immigrants | Bosnia and Herzegovina | 22.0 /100 | #194 | Fair 17.4% |