Nepalese vs Ecuadorian Cognitive Disability
COMPARE
Nepalese
Ecuadorian
Cognitive Disability
Cognitive Disability Comparison
Nepalese
Ecuadorians
18.0%
COGNITIVE DISABILITY
0.3/ 100
METRIC RATING
267th/ 347
METRIC RANK
17.2%
COGNITIVE DISABILITY
59.6/ 100
METRIC RATING
170th/ 347
METRIC RANK
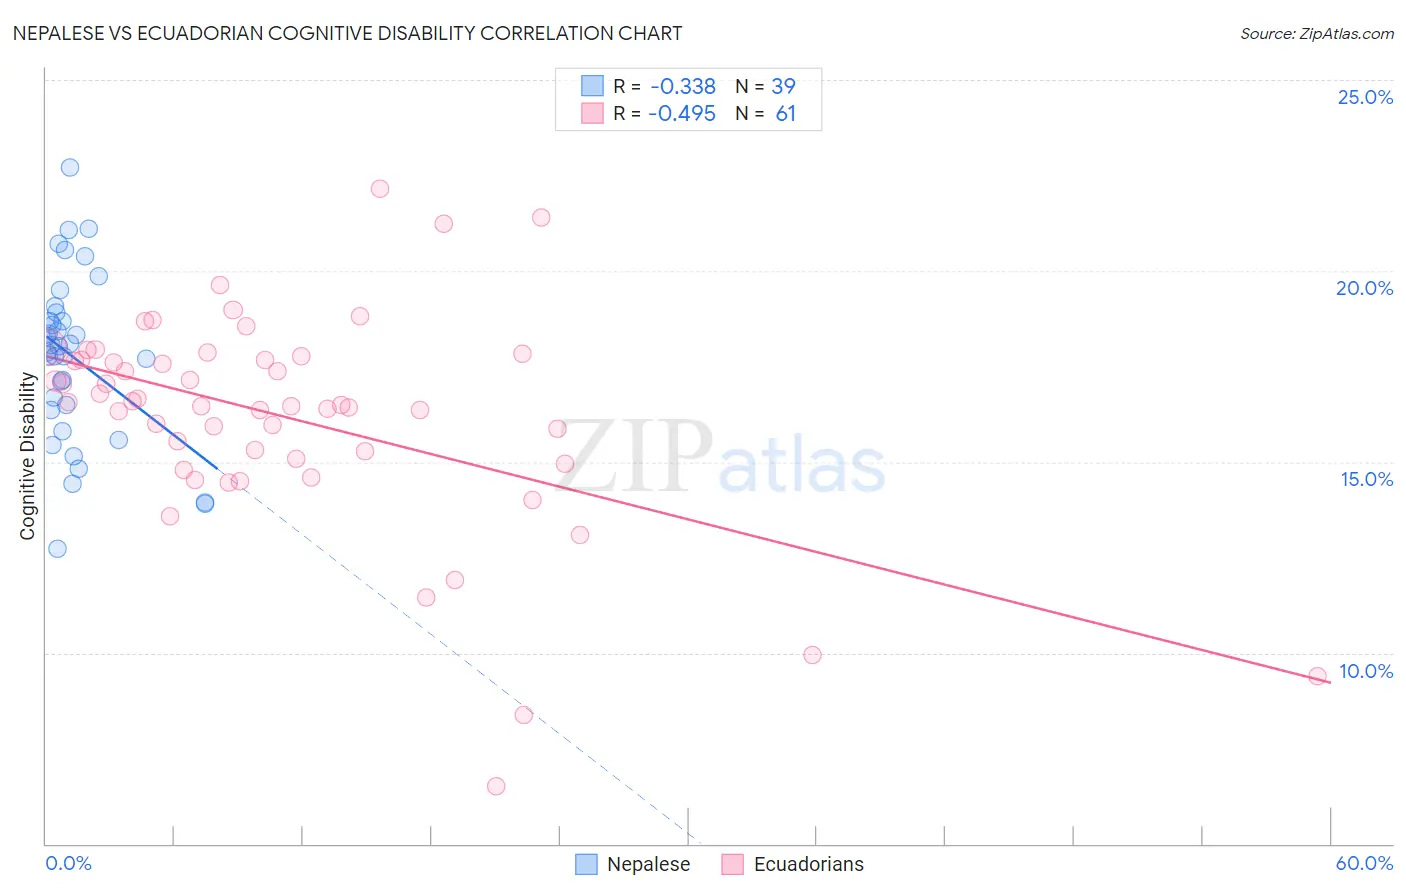
Nepalese vs Ecuadorian Cognitive Disability Correlation Chart
The statistical analysis conducted on geographies consisting of 24,519,269 people shows a mild negative correlation between the proportion of Nepalese and percentage of population with cognitive disability in the United States with a correlation coefficient (R) of -0.338 and weighted average of 18.0%. Similarly, the statistical analysis conducted on geographies consisting of 317,812,387 people shows a moderate negative correlation between the proportion of Ecuadorians and percentage of population with cognitive disability in the United States with a correlation coefficient (R) of -0.495 and weighted average of 17.2%, a difference of 4.3%.
Cognitive Disability Correlation Summary
| Measurement | Nepalese | Ecuadorian |
| Minimum | 12.7% | 6.5% |
| Maximum | 22.7% | 22.2% |
| Range | 10.0% | 15.7% |
| Mean | 17.7% | 16.2% |
| Median | 18.0% | 16.5% |
| Interquartile 25% (IQ1) | 16.4% | 15.0% |
| Interquartile 75% (IQ3) | 18.9% | 17.7% |
| Interquartile Range (IQR) | 2.6% | 2.7% |
| Standard Deviation (Sample) | 2.2% | 2.9% |
| Standard Deviation (Population) | 2.2% | 2.8% |
Similar Demographics by Cognitive Disability
Demographics Similar to Nepalese by Cognitive Disability
In terms of cognitive disability, the demographic groups most similar to Nepalese are Cherokee (18.0%, a difference of 0.010%), Spanish American (18.0%, a difference of 0.060%), Belizean (18.0%, a difference of 0.060%), Menominee (18.0%, a difference of 0.090%), and Immigrants from Barbados (17.9%, a difference of 0.15%).
| Demographics | Rating | Rank | Cognitive Disability |
| Immigrants | Belize | 0.5 /100 | #260 | Tragic 17.9% |
| Guamanians/Chamorros | 0.5 /100 | #261 | Tragic 17.9% |
| Sierra Leoneans | 0.4 /100 | #262 | Tragic 17.9% |
| Immigrants | Barbados | 0.4 /100 | #263 | Tragic 17.9% |
| Menominee | 0.4 /100 | #264 | Tragic 18.0% |
| Spanish Americans | 0.4 /100 | #265 | Tragic 18.0% |
| Belizeans | 0.4 /100 | #266 | Tragic 18.0% |
| Nepalese | 0.3 /100 | #267 | Tragic 18.0% |
| Cherokee | 0.3 /100 | #268 | Tragic 18.0% |
| Hondurans | 0.3 /100 | #269 | Tragic 18.0% |
| Immigrants | Bahamas | 0.3 /100 | #270 | Tragic 18.0% |
| Potawatomi | 0.2 /100 | #271 | Tragic 18.0% |
| Immigrants | Honduras | 0.2 /100 | #272 | Tragic 18.0% |
| Immigrants | Nepal | 0.2 /100 | #273 | Tragic 18.0% |
| Immigrants | Nigeria | 0.2 /100 | #274 | Tragic 18.0% |
Demographics Similar to Ecuadorians by Cognitive Disability
In terms of cognitive disability, the demographic groups most similar to Ecuadorians are Tlingit-Haida (17.2%, a difference of 0.0%), Immigrants from Portugal (17.2%, a difference of 0.070%), Immigrants (17.2%, a difference of 0.090%), Immigrants from Turkey (17.2%, a difference of 0.090%), and Immigrants from Syria (17.2%, a difference of 0.12%).
| Demographics | Rating | Rank | Cognitive Disability |
| Immigrants | Switzerland | 71.5 /100 | #163 | Good 17.2% |
| Armenians | 70.1 /100 | #164 | Good 17.2% |
| Immigrants | Albania | 64.9 /100 | #165 | Good 17.2% |
| Immigrants | Ecuador | 64.4 /100 | #166 | Good 17.2% |
| Immigrants | Syria | 63.5 /100 | #167 | Good 17.2% |
| Immigrants | Immigrants | 62.5 /100 | #168 | Good 17.2% |
| Immigrants | Portugal | 61.8 /100 | #169 | Good 17.2% |
| Ecuadorians | 59.6 /100 | #170 | Average 17.2% |
| Tlingit-Haida | 59.4 /100 | #171 | Average 17.2% |
| Immigrants | Turkey | 56.7 /100 | #172 | Average 17.2% |
| Immigrants | Northern Africa | 50.2 /100 | #173 | Average 17.3% |
| Laotians | 50.0 /100 | #174 | Average 17.3% |
| Tsimshian | 49.8 /100 | #175 | Average 17.3% |
| Shoshone | 49.2 /100 | #176 | Average 17.3% |
| Ute | 49.1 /100 | #177 | Average 17.3% |