British vs Icelander Disability Age 18 to 34
COMPARE
British
Icelander
Disability Age 18 to 34
Disability Age 18 to 34 Comparison
British
Icelanders
7.3%
DISABILITY AGE 18 TO 34
0.2/ 100
METRIC RATING
263rd/ 347
METRIC RANK
7.1%
DISABILITY AGE 18 TO 34
1.0/ 100
METRIC RATING
243rd/ 347
METRIC RANK
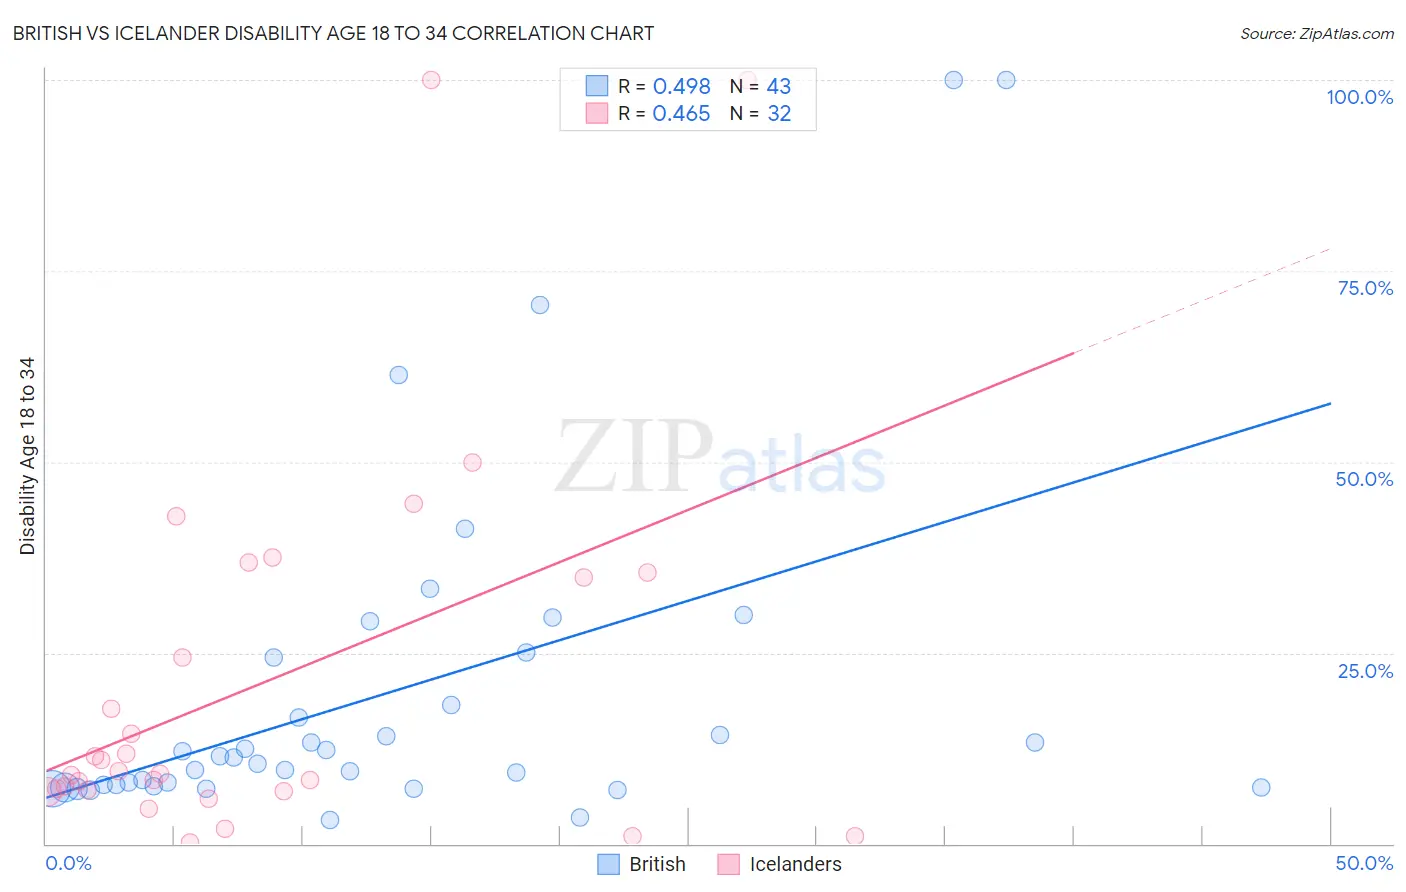
British vs Icelander Disability Age 18 to 34 Correlation Chart
The statistical analysis conducted on geographies consisting of 528,221,956 people shows a moderate positive correlation between the proportion of British and percentage of population with a disability between the ages 18 and 35 in the United States with a correlation coefficient (R) of 0.498 and weighted average of 7.3%. Similarly, the statistical analysis conducted on geographies consisting of 159,438,295 people shows a moderate positive correlation between the proportion of Icelanders and percentage of population with a disability between the ages 18 and 35 in the United States with a correlation coefficient (R) of 0.465 and weighted average of 7.1%, a difference of 2.9%.
Disability Age 18 to 34 Correlation Summary
| Measurement | British | Icelander |
| Minimum | 3.0% | 0.23% |
| Maximum | 100.0% | 100.0% |
| Range | 97.0% | 99.8% |
| Mean | 19.9% | 21.1% |
| Median | 11.2% | 9.3% |
| Interquartile 25% (IQ1) | 7.5% | 7.0% |
| Interquartile 75% (IQ3) | 24.4% | 35.2% |
| Interquartile Range (IQR) | 16.9% | 28.2% |
| Standard Deviation (Sample) | 22.8% | 25.1% |
| Standard Deviation (Population) | 22.5% | 24.7% |
Demographics Similar to British and Icelanders by Disability Age 18 to 34
In terms of disability age 18 to 34, the demographic groups most similar to British are Canadian (7.3%, a difference of 0.29%), Northern European (7.3%, a difference of 0.32%), Tohono O'odham (7.3%, a difference of 0.49%), Somali (7.3%, a difference of 0.55%), and Immigrants from Micronesia (7.3%, a difference of 0.62%). Similarly, the demographic groups most similar to Icelanders are Immigrants from Zaire (7.1%, a difference of 0.20%), Hungarian (7.1%, a difference of 0.31%), Immigrants from Liberia (7.1%, a difference of 0.33%), Yugoslavian (7.2%, a difference of 0.48%), and Guamanian/Chamorro (7.2%, a difference of 0.51%).
| Demographics | Rating | Rank | Disability Age 18 to 34 |
| Icelanders | 1.0 /100 | #243 | Tragic 7.1% |
| Immigrants | Zaire | 0.9 /100 | #244 | Tragic 7.1% |
| Hungarians | 0.9 /100 | #245 | Tragic 7.1% |
| Immigrants | Liberia | 0.8 /100 | #246 | Tragic 7.1% |
| Yugoslavians | 0.8 /100 | #247 | Tragic 7.2% |
| Guamanians/Chamorros | 0.8 /100 | #248 | Tragic 7.2% |
| Malaysians | 0.7 /100 | #249 | Tragic 7.2% |
| Fijians | 0.6 /100 | #250 | Tragic 7.2% |
| Spaniards | 0.6 /100 | #251 | Tragic 7.2% |
| Poles | 0.6 /100 | #252 | Tragic 7.2% |
| Croatians | 0.5 /100 | #253 | Tragic 7.2% |
| Indonesians | 0.4 /100 | #254 | Tragic 7.2% |
| Immigrants | Germany | 0.4 /100 | #255 | Tragic 7.2% |
| Immigrants | Laos | 0.4 /100 | #256 | Tragic 7.2% |
| Czechs | 0.3 /100 | #257 | Tragic 7.2% |
| Immigrants | Micronesia | 0.3 /100 | #258 | Tragic 7.3% |
| Somalis | 0.2 /100 | #259 | Tragic 7.3% |
| Tohono O'odham | 0.2 /100 | #260 | Tragic 7.3% |
| Northern Europeans | 0.2 /100 | #261 | Tragic 7.3% |
| Canadians | 0.2 /100 | #262 | Tragic 7.3% |
| British | 0.2 /100 | #263 | Tragic 7.3% |