Nepalese vs Taiwanese Disability Age 18 to 34
COMPARE
Nepalese
Taiwanese
Disability Age 18 to 34
Disability Age 18 to 34 Comparison
Nepalese
Taiwanese
7.1%
DISABILITY AGE 18 TO 34
1.1/ 100
METRIC RATING
241st/ 347
METRIC RANK
6.0%
DISABILITY AGE 18 TO 34
99.6/ 100
METRIC RATING
64th/ 347
METRIC RANK
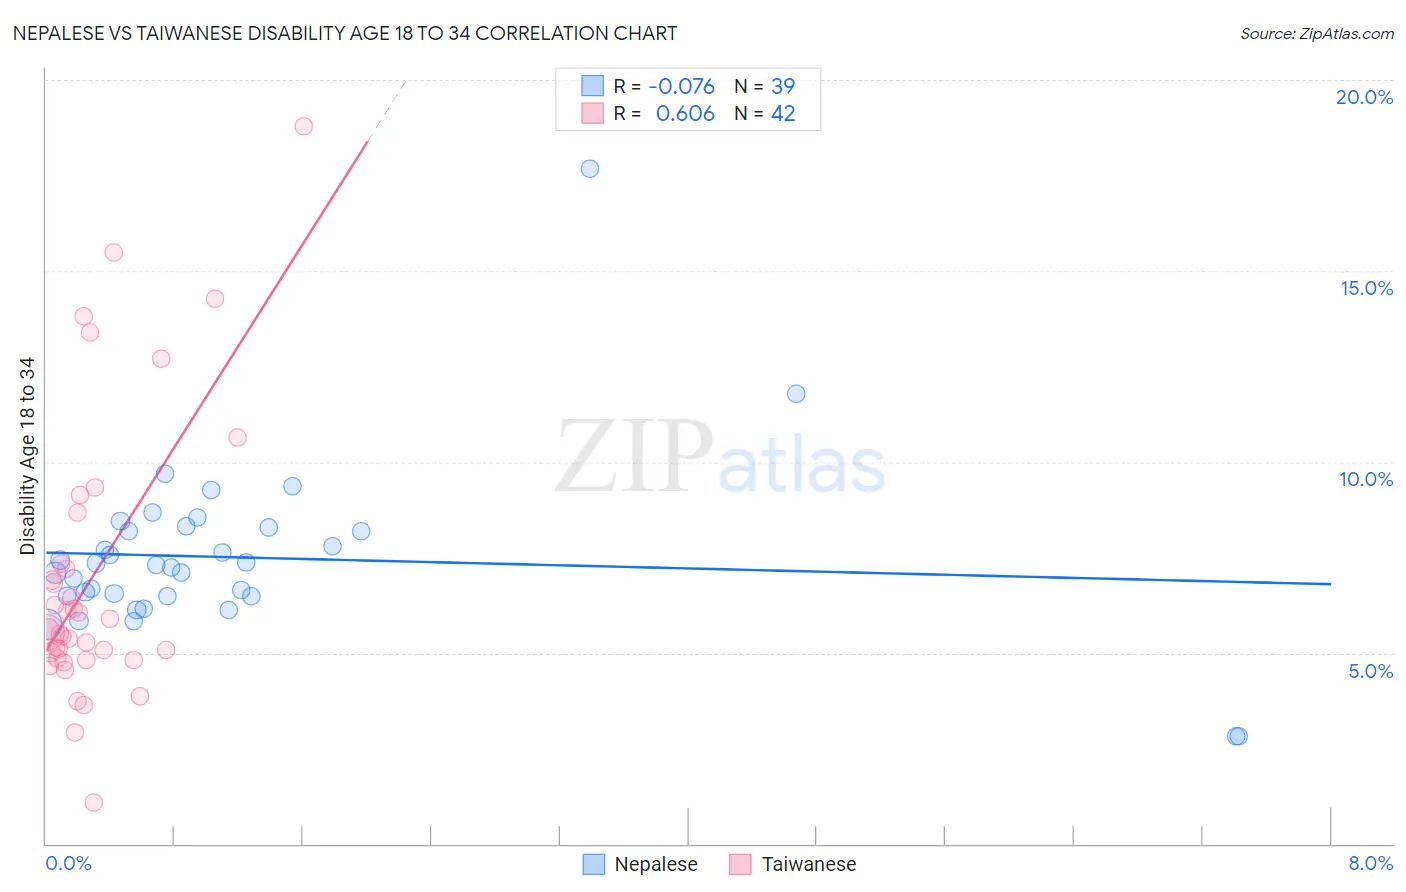
Nepalese vs Taiwanese Disability Age 18 to 34 Correlation Chart
The statistical analysis conducted on geographies consisting of 24,520,458 people shows a slight negative correlation between the proportion of Nepalese and percentage of population with a disability between the ages 18 and 35 in the United States with a correlation coefficient (R) of -0.076 and weighted average of 7.1%. Similarly, the statistical analysis conducted on geographies consisting of 31,720,747 people shows a significant positive correlation between the proportion of Taiwanese and percentage of population with a disability between the ages 18 and 35 in the United States with a correlation coefficient (R) of 0.606 and weighted average of 6.0%, a difference of 19.0%.
Disability Age 18 to 34 Correlation Summary
| Measurement | Nepalese | Taiwanese |
| Minimum | 2.8% | 1.1% |
| Maximum | 17.7% | 18.8% |
| Range | 14.9% | 17.7% |
| Mean | 7.5% | 7.0% |
| Median | 7.3% | 5.6% |
| Interquartile 25% (IQ1) | 6.5% | 4.8% |
| Interquartile 75% (IQ3) | 8.3% | 7.3% |
| Interquartile Range (IQR) | 1.8% | 2.5% |
| Standard Deviation (Sample) | 2.3% | 3.7% |
| Standard Deviation (Population) | 2.3% | 3.7% |
Similar Demographics by Disability Age 18 to 34
Demographics Similar to Nepalese by Disability Age 18 to 34
In terms of disability age 18 to 34, the demographic groups most similar to Nepalese are Arapaho (7.1%, a difference of 0.0%), Immigrants from Congo (7.1%, a difference of 0.040%), Icelander (7.1%, a difference of 0.11%), Italian (7.1%, a difference of 0.12%), and Marshallese (7.1%, a difference of 0.24%).
| Demographics | Rating | Rank | Disability Age 18 to 34 |
| Alsatians | 2.1 /100 | #234 | Tragic 7.0% |
| Sub-Saharan Africans | 1.7 /100 | #235 | Tragic 7.1% |
| Liberians | 1.5 /100 | #236 | Tragic 7.1% |
| Austrians | 1.3 /100 | #237 | Tragic 7.1% |
| Marshallese | 1.3 /100 | #238 | Tragic 7.1% |
| Italians | 1.2 /100 | #239 | Tragic 7.1% |
| Arapaho | 1.1 /100 | #240 | Tragic 7.1% |
| Nepalese | 1.1 /100 | #241 | Tragic 7.1% |
| Immigrants | Congo | 1.1 /100 | #242 | Tragic 7.1% |
| Icelanders | 1.0 /100 | #243 | Tragic 7.1% |
| Immigrants | Zaire | 0.9 /100 | #244 | Tragic 7.1% |
| Hungarians | 0.9 /100 | #245 | Tragic 7.1% |
| Immigrants | Liberia | 0.8 /100 | #246 | Tragic 7.1% |
| Yugoslavians | 0.8 /100 | #247 | Tragic 7.2% |
| Guamanians/Chamorros | 0.8 /100 | #248 | Tragic 7.2% |
Demographics Similar to Taiwanese by Disability Age 18 to 34
In terms of disability age 18 to 34, the demographic groups most similar to Taiwanese are Salvadoran (6.0%, a difference of 0.010%), Peruvian (6.0%, a difference of 0.070%), British West Indian (6.0%, a difference of 0.090%), Trinidadian and Tobagonian (6.0%, a difference of 0.14%), and Burmese (6.0%, a difference of 0.28%).
| Demographics | Rating | Rank | Disability Age 18 to 34 |
| Immigrants | Haiti | 99.7 /100 | #57 | Exceptional 5.9% |
| Immigrants | Serbia | 99.7 /100 | #58 | Exceptional 5.9% |
| Immigrants | Caribbean | 99.6 /100 | #59 | Exceptional 6.0% |
| Immigrants | Sri Lanka | 99.6 /100 | #60 | Exceptional 6.0% |
| British West Indians | 99.6 /100 | #61 | Exceptional 6.0% |
| Peruvians | 99.6 /100 | #62 | Exceptional 6.0% |
| Salvadorans | 99.6 /100 | #63 | Exceptional 6.0% |
| Taiwanese | 99.6 /100 | #64 | Exceptional 6.0% |
| Trinidadians and Tobagonians | 99.5 /100 | #65 | Exceptional 6.0% |
| Burmese | 99.5 /100 | #66 | Exceptional 6.0% |
| Immigrants | North Macedonia | 99.5 /100 | #67 | Exceptional 6.0% |
| Immigrants | Poland | 99.5 /100 | #68 | Exceptional 6.0% |
| Immigrants | West Indies | 99.4 /100 | #69 | Exceptional 6.0% |
| Immigrants | Greece | 99.4 /100 | #70 | Exceptional 6.0% |
| Immigrants | Japan | 99.3 /100 | #71 | Exceptional 6.0% |