British vs Immigrants from Colombia Cognitive Disability
COMPARE
British
Immigrants from Colombia
Cognitive Disability
Cognitive Disability Comparison
British
Immigrants from Colombia
17.0%
COGNITIVE DISABILITY
89.3/ 100
METRIC RATING
143rd/ 347
METRIC RANK
16.5%
COGNITIVE DISABILITY
99.8/ 100
METRIC RATING
46th/ 347
METRIC RANK
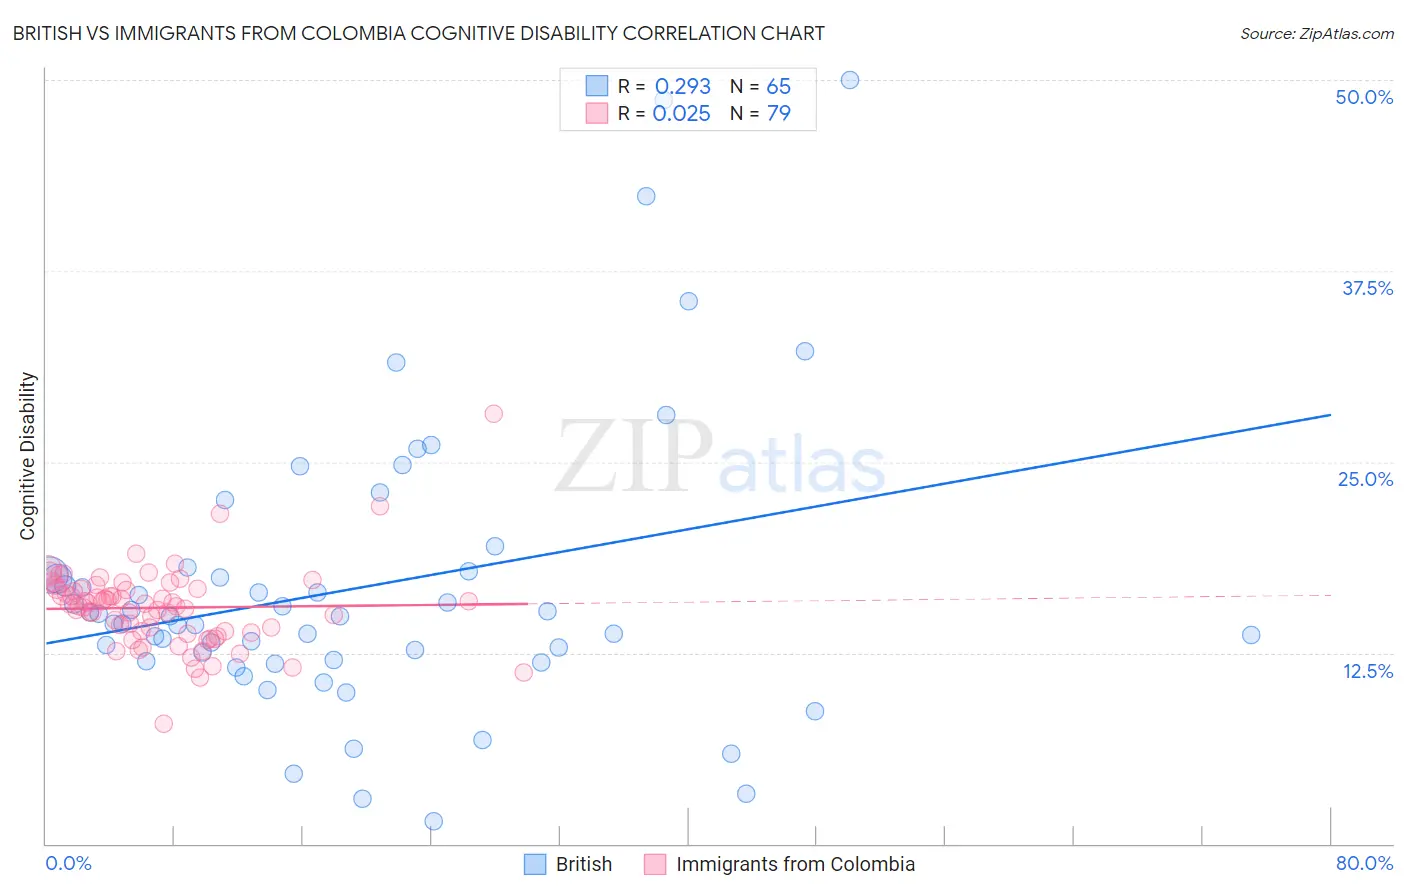
British vs Immigrants from Colombia Cognitive Disability Correlation Chart
The statistical analysis conducted on geographies consisting of 531,402,976 people shows a weak positive correlation between the proportion of British and percentage of population with cognitive disability in the United States with a correlation coefficient (R) of 0.293 and weighted average of 17.0%. Similarly, the statistical analysis conducted on geographies consisting of 378,642,533 people shows no correlation between the proportion of Immigrants from Colombia and percentage of population with cognitive disability in the United States with a correlation coefficient (R) of 0.025 and weighted average of 16.5%, a difference of 3.2%.
Cognitive Disability Correlation Summary
| Measurement | British | Immigrants from Colombia |
| Minimum | 1.5% | 7.9% |
| Maximum | 50.0% | 28.2% |
| Range | 48.5% | 20.3% |
| Mean | 16.7% | 15.4% |
| Median | 14.9% | 15.7% |
| Interquartile 25% (IQ1) | 12.0% | 13.9% |
| Interquartile 75% (IQ3) | 17.7% | 16.7% |
| Interquartile Range (IQR) | 5.7% | 2.8% |
| Standard Deviation (Sample) | 9.5% | 2.7% |
| Standard Deviation (Population) | 9.4% | 2.7% |
Similar Demographics by Cognitive Disability
Demographics Similar to British by Cognitive Disability
In terms of cognitive disability, the demographic groups most similar to British are Immigrants from Brazil (17.0%, a difference of 0.0%), Carpatho Rusyn (17.0%, a difference of 0.020%), French (17.0%, a difference of 0.050%), Chilean (17.0%, a difference of 0.050%), and Aleut (17.0%, a difference of 0.050%).
| Demographics | Rating | Rank | Cognitive Disability |
| Israelis | 91.0 /100 | #136 | Exceptional 17.0% |
| Immigrants | Norway | 90.9 /100 | #137 | Exceptional 17.0% |
| Welsh | 90.8 /100 | #138 | Exceptional 17.0% |
| French | 90.0 /100 | #139 | Excellent 17.0% |
| Chileans | 89.9 /100 | #140 | Excellent 17.0% |
| Aleuts | 89.9 /100 | #141 | Excellent 17.0% |
| Carpatho Rusyns | 89.6 /100 | #142 | Excellent 17.0% |
| British | 89.3 /100 | #143 | Excellent 17.0% |
| Immigrants | Brazil | 89.3 /100 | #144 | Excellent 17.0% |
| Immigrants | South Eastern Asia | 88.7 /100 | #145 | Excellent 17.0% |
| Costa Ricans | 88.0 /100 | #146 | Excellent 17.0% |
| Scotch-Irish | 85.9 /100 | #147 | Excellent 17.1% |
| French Canadians | 85.7 /100 | #148 | Excellent 17.1% |
| Cypriots | 85.7 /100 | #149 | Excellent 17.1% |
| Basques | 85.5 /100 | #150 | Excellent 17.1% |
Demographics Similar to Immigrants from Colombia by Cognitive Disability
In terms of cognitive disability, the demographic groups most similar to Immigrants from Colombia are Immigrants from Europe (16.5%, a difference of 0.010%), Macedonian (16.5%, a difference of 0.020%), Immigrants from Italy (16.5%, a difference of 0.030%), Immigrants from North America (16.5%, a difference of 0.030%), and Immigrants from Canada (16.5%, a difference of 0.050%).
| Demographics | Rating | Rank | Cognitive Disability |
| Bolivians | 99.9 /100 | #39 | Exceptional 16.5% |
| Immigrants | Belarus | 99.9 /100 | #40 | Exceptional 16.5% |
| Cubans | 99.9 /100 | #41 | Exceptional 16.5% |
| Hungarians | 99.9 /100 | #42 | Exceptional 16.5% |
| Immigrants | Canada | 99.8 /100 | #43 | Exceptional 16.5% |
| Macedonians | 99.8 /100 | #44 | Exceptional 16.5% |
| Immigrants | Europe | 99.8 /100 | #45 | Exceptional 16.5% |
| Immigrants | Colombia | 99.8 /100 | #46 | Exceptional 16.5% |
| Immigrants | Italy | 99.8 /100 | #47 | Exceptional 16.5% |
| Immigrants | North America | 99.8 /100 | #48 | Exceptional 16.5% |
| Iranians | 99.8 /100 | #49 | Exceptional 16.5% |
| Norwegians | 99.8 /100 | #50 | Exceptional 16.5% |
| Immigrants | Korea | 99.8 /100 | #51 | Exceptional 16.5% |
| Soviet Union | 99.8 /100 | #52 | Exceptional 16.5% |
| Swedes | 99.8 /100 | #53 | Exceptional 16.5% |