Native/Alaskan vs Immigrants from Sierra Leone In Labor Force | Age 20-24
COMPARE
Native/Alaskan
Immigrants from Sierra Leone
In Labor Force | Age 20-24
In Labor Force | Age 20-24 Comparison
Natives/Alaskans
Immigrants from Sierra Leone
72.4%
IN LABOR FORCE | AGE 20-24
0.0/ 100
METRIC RATING
302nd/ 347
METRIC RANK
75.8%
IN LABOR FORCE | AGE 20-24
93.8/ 100
METRIC RATING
124th/ 347
METRIC RANK
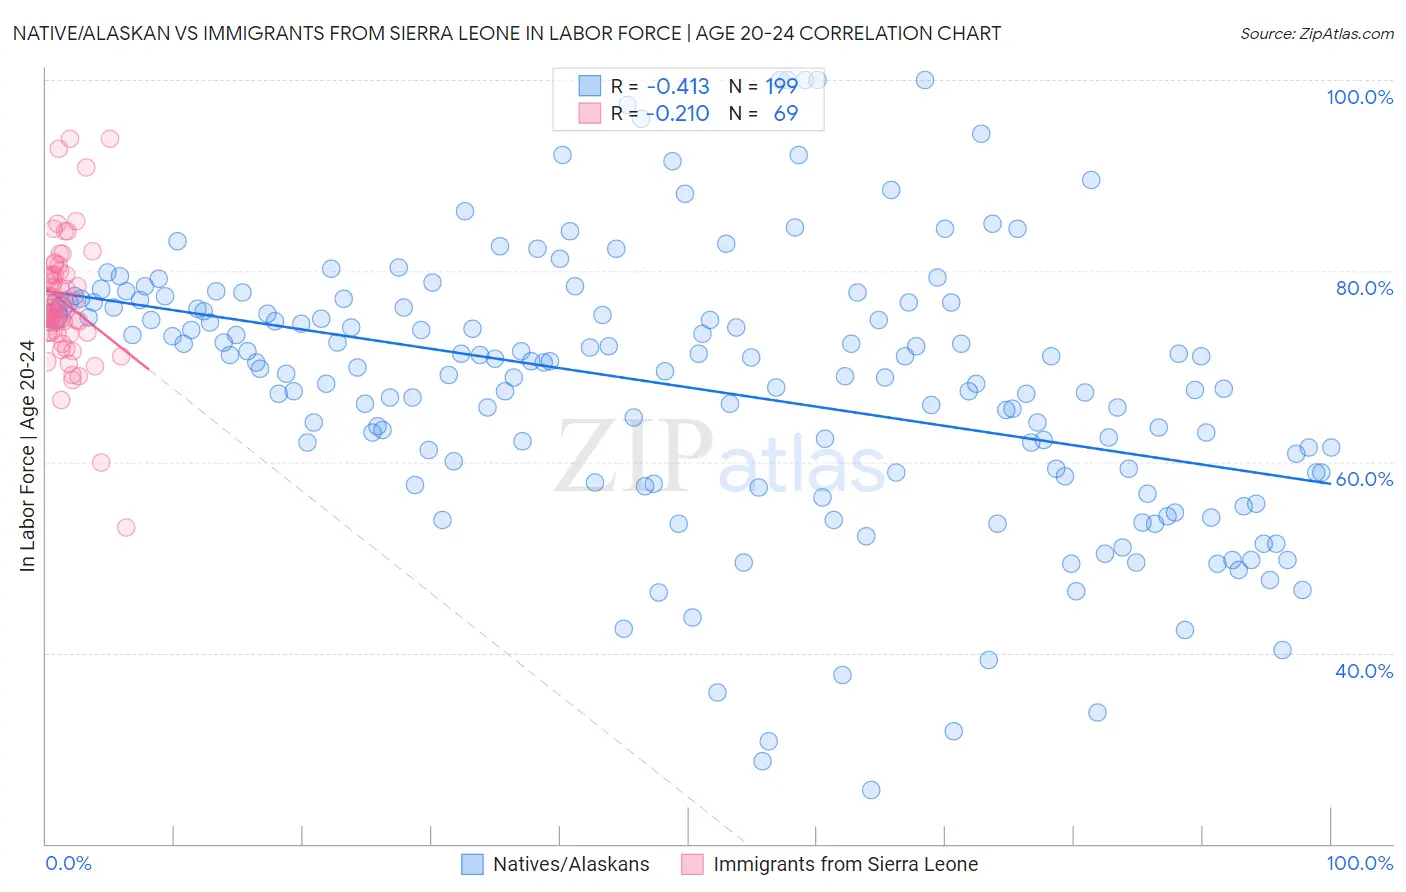
Native/Alaskan vs Immigrants from Sierra Leone In Labor Force | Age 20-24 Correlation Chart
The statistical analysis conducted on geographies consisting of 512,418,491 people shows a moderate negative correlation between the proportion of Natives/Alaskans and labor force participation rate among population between the ages 20 and 24 in the United States with a correlation coefficient (R) of -0.413 and weighted average of 72.4%. Similarly, the statistical analysis conducted on geographies consisting of 101,648,861 people shows a weak negative correlation between the proportion of Immigrants from Sierra Leone and labor force participation rate among population between the ages 20 and 24 in the United States with a correlation coefficient (R) of -0.210 and weighted average of 75.8%, a difference of 4.6%.
In Labor Force | Age 20-24 Correlation Summary
| Measurement | Native/Alaskan | Immigrants from Sierra Leone |
| Minimum | 25.7% | 53.1% |
| Maximum | 100.0% | 93.9% |
| Range | 74.3% | 40.8% |
| Mean | 67.8% | 76.7% |
| Median | 69.8% | 75.9% |
| Interquartile 25% (IQ1) | 58.9% | 73.5% |
| Interquartile 75% (IQ3) | 76.2% | 79.6% |
| Interquartile Range (IQR) | 17.3% | 6.1% |
| Standard Deviation (Sample) | 14.2% | 6.7% |
| Standard Deviation (Population) | 14.2% | 6.6% |
Similar Demographics by In Labor Force | Age 20-24
Demographics Similar to Natives/Alaskans by In Labor Force | Age 20-24
In terms of in labor force | age 20-24, the demographic groups most similar to Natives/Alaskans are Ecuadorian (72.4%, a difference of 0.010%), Immigrants from West Indies (72.4%, a difference of 0.020%), Immigrants from Singapore (72.4%, a difference of 0.050%), Immigrants from Jamaica (72.4%, a difference of 0.070%), and Cuban (72.5%, a difference of 0.090%).
| Demographics | Rating | Rank | In Labor Force | Age 20-24 |
| Okinawans | 0.0 /100 | #295 | Tragic 72.7% |
| Jamaicans | 0.0 /100 | #296 | Tragic 72.7% |
| Central American Indians | 0.0 /100 | #297 | Tragic 72.7% |
| Israelis | 0.0 /100 | #298 | Tragic 72.6% |
| Iranians | 0.0 /100 | #299 | Tragic 72.6% |
| Armenians | 0.0 /100 | #300 | Tragic 72.5% |
| Cubans | 0.0 /100 | #301 | Tragic 72.5% |
| Natives/Alaskans | 0.0 /100 | #302 | Tragic 72.4% |
| Ecuadorians | 0.0 /100 | #303 | Tragic 72.4% |
| Immigrants | West Indies | 0.0 /100 | #304 | Tragic 72.4% |
| Immigrants | Singapore | 0.0 /100 | #305 | Tragic 72.4% |
| Immigrants | Jamaica | 0.0 /100 | #306 | Tragic 72.4% |
| Immigrants | Ecuador | 0.0 /100 | #307 | Tragic 72.3% |
| Soviet Union | 0.0 /100 | #308 | Tragic 72.3% |
| Tsimshian | 0.0 /100 | #309 | Tragic 72.3% |
Demographics Similar to Immigrants from Sierra Leone by In Labor Force | Age 20-24
In terms of in labor force | age 20-24, the demographic groups most similar to Immigrants from Sierra Leone are Immigrants from Scotland (75.8%, a difference of 0.010%), Pakistani (75.8%, a difference of 0.020%), Immigrants from Bulgaria (75.8%, a difference of 0.020%), Immigrants from Serbia (75.8%, a difference of 0.030%), and Immigrants from Africa (75.8%, a difference of 0.050%).
| Demographics | Rating | Rank | In Labor Force | Age 20-24 |
| Assyrians/Chaldeans/Syriacs | 94.9 /100 | #117 | Exceptional 75.9% |
| Spanish Americans | 94.8 /100 | #118 | Exceptional 75.8% |
| Immigrants | Portugal | 94.8 /100 | #119 | Exceptional 75.8% |
| Immigrants | Africa | 94.6 /100 | #120 | Exceptional 75.8% |
| Immigrants | Serbia | 94.3 /100 | #121 | Exceptional 75.8% |
| Pakistanis | 94.1 /100 | #122 | Exceptional 75.8% |
| Immigrants | Bulgaria | 94.1 /100 | #123 | Exceptional 75.8% |
| Immigrants | Sierra Leone | 93.8 /100 | #124 | Exceptional 75.8% |
| Immigrants | Scotland | 93.7 /100 | #125 | Exceptional 75.8% |
| Brazilians | 93.0 /100 | #126 | Exceptional 75.8% |
| Sub-Saharan Africans | 90.9 /100 | #127 | Exceptional 75.7% |
| Immigrants | Afghanistan | 89.4 /100 | #128 | Excellent 75.6% |
| Iroquois | 89.1 /100 | #129 | Excellent 75.6% |
| Immigrants | Austria | 88.8 /100 | #130 | Excellent 75.6% |
| Immigrants | Jordan | 88.5 /100 | #131 | Excellent 75.6% |