Moroccan vs English Cognitive Disability
COMPARE
Moroccan
English
Cognitive Disability
Cognitive Disability Comparison
Moroccans
English
17.6%
COGNITIVE DISABILITY
5.9/ 100
METRIC RATING
221st/ 347
METRIC RANK
16.8%
COGNITIVE DISABILITY
98.6/ 100
METRIC RATING
95th/ 347
METRIC RANK
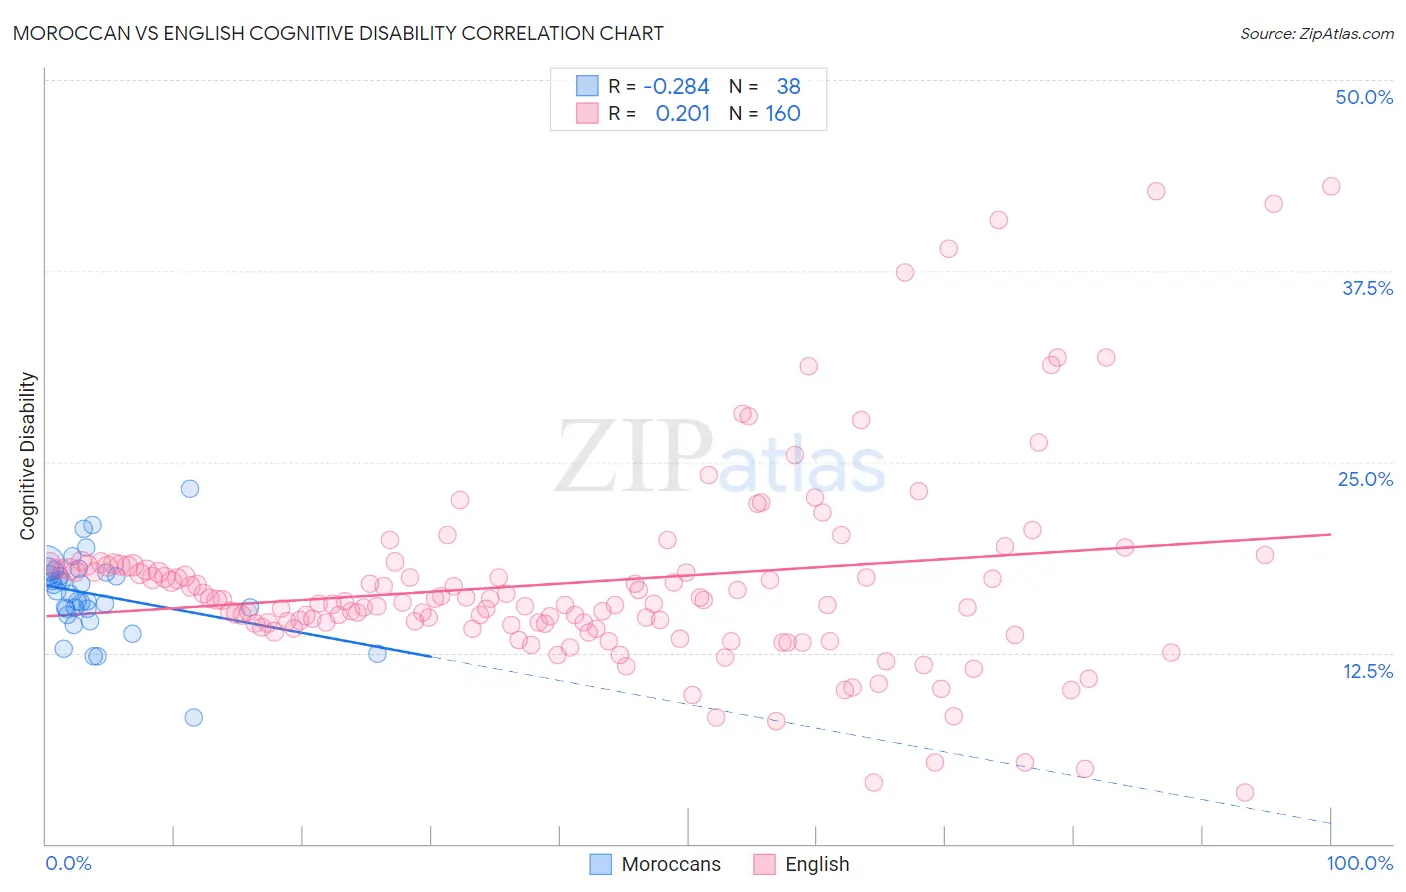
Moroccan vs English Cognitive Disability Correlation Chart
The statistical analysis conducted on geographies consisting of 201,805,523 people shows a weak negative correlation between the proportion of Moroccans and percentage of population with cognitive disability in the United States with a correlation coefficient (R) of -0.284 and weighted average of 17.6%. Similarly, the statistical analysis conducted on geographies consisting of 579,706,008 people shows a weak positive correlation between the proportion of English and percentage of population with cognitive disability in the United States with a correlation coefficient (R) of 0.201 and weighted average of 16.8%, a difference of 5.1%.
Cognitive Disability Correlation Summary
| Measurement | Moroccan | English |
| Minimum | 8.3% | 3.4% |
| Maximum | 23.2% | 43.0% |
| Range | 15.0% | 39.7% |
| Mean | 16.3% | 17.1% |
| Median | 16.4% | 15.8% |
| Interquartile 25% (IQ1) | 15.4% | 14.3% |
| Interquartile 75% (IQ3) | 17.7% | 18.1% |
| Interquartile Range (IQR) | 2.3% | 3.8% |
| Standard Deviation (Sample) | 2.7% | 6.6% |
| Standard Deviation (Population) | 2.7% | 6.6% |
Similar Demographics by Cognitive Disability
Demographics Similar to Moroccans by Cognitive Disability
In terms of cognitive disability, the demographic groups most similar to Moroccans are Zimbabwean (17.6%, a difference of 0.020%), Icelander (17.6%, a difference of 0.050%), Immigrants from Sierra Leone (17.6%, a difference of 0.050%), Salvadoran (17.6%, a difference of 0.090%), and Okinawan (17.6%, a difference of 0.10%).
| Demographics | Rating | Rank | Cognitive Disability |
| Immigrants | El Salvador | 7.0 /100 | #214 | Tragic 17.6% |
| Alaskan Athabascans | 6.9 /100 | #215 | Tragic 17.6% |
| Okinawans | 6.8 /100 | #216 | Tragic 17.6% |
| Salvadorans | 6.7 /100 | #217 | Tragic 17.6% |
| Icelanders | 6.4 /100 | #218 | Tragic 17.6% |
| Immigrants | Sierra Leone | 6.3 /100 | #219 | Tragic 17.6% |
| Zimbabweans | 6.1 /100 | #220 | Tragic 17.6% |
| Moroccans | 5.9 /100 | #221 | Tragic 17.6% |
| Central Americans | 4.5 /100 | #222 | Tragic 17.7% |
| Alsatians | 4.5 /100 | #223 | Tragic 17.7% |
| Fijians | 3.4 /100 | #224 | Tragic 17.7% |
| Vietnamese | 3.4 /100 | #225 | Tragic 17.7% |
| Marshallese | 2.7 /100 | #226 | Tragic 17.7% |
| Immigrants | St. Vincent and the Grenadines | 2.6 /100 | #227 | Tragic 17.7% |
| Immigrants | Central America | 2.3 /100 | #228 | Tragic 17.7% |
Demographics Similar to English by Cognitive Disability
In terms of cognitive disability, the demographic groups most similar to English are Finnish (16.8%, a difference of 0.020%), Dutch (16.8%, a difference of 0.040%), Asian (16.7%, a difference of 0.060%), Immigrants from Lebanon (16.8%, a difference of 0.060%), and Immigrants from South America (16.7%, a difference of 0.11%).
| Demographics | Rating | Rank | Cognitive Disability |
| Immigrants | Philippines | 99.0 /100 | #88 | Exceptional 16.7% |
| Immigrants | Egypt | 98.8 /100 | #89 | Exceptional 16.7% |
| South Americans | 98.8 /100 | #90 | Exceptional 16.7% |
| Danes | 98.8 /100 | #91 | Exceptional 16.7% |
| Immigrants | South America | 98.8 /100 | #92 | Exceptional 16.7% |
| Immigrants | Southern Europe | 98.7 /100 | #93 | Exceptional 16.7% |
| Asians | 98.7 /100 | #94 | Exceptional 16.7% |
| English | 98.6 /100 | #95 | Exceptional 16.8% |
| Finns | 98.5 /100 | #96 | Exceptional 16.8% |
| Dutch | 98.5 /100 | #97 | Exceptional 16.8% |
| Immigrants | Lebanon | 98.4 /100 | #98 | Exceptional 16.8% |
| Jordanians | 98.2 /100 | #99 | Exceptional 16.8% |
| Immigrants | Russia | 98.2 /100 | #100 | Exceptional 16.8% |
| Immigrants | Asia | 98.1 /100 | #101 | Exceptional 16.8% |
| Irish | 98.1 /100 | #102 | Exceptional 16.8% |