Moroccan vs Yup'ik Householder Income Ages 45 - 64 years
COMPARE
Moroccan
Yup'ik
Householder Income Ages 45 - 64 years
Householder Income Ages 45 - 64 years Comparison
Moroccans
Yup'ik
$100,138
HOUSEHOLDER INCOME AGES 45 - 64 YEARS
47.7/ 100
METRIC RATING
177th/ 347
METRIC RANK
$81,000
HOUSEHOLDER INCOME AGES 45 - 64 YEARS
0.0/ 100
METRIC RATING
324th/ 347
METRIC RANK
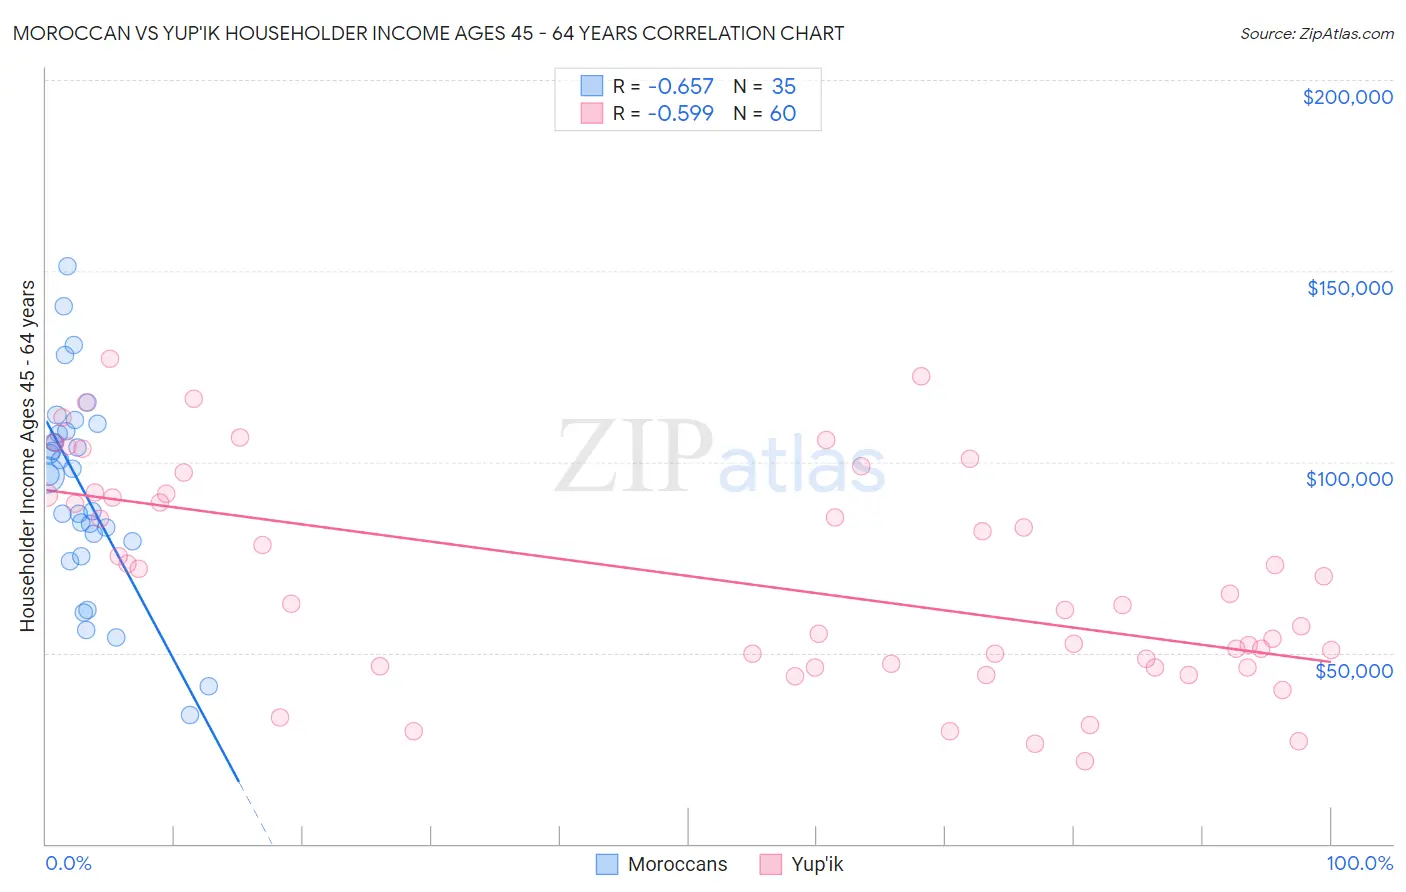
Moroccan vs Yup'ik Householder Income Ages 45 - 64 years Correlation Chart
The statistical analysis conducted on geographies consisting of 201,649,728 people shows a significant negative correlation between the proportion of Moroccans and household income with householder between the ages 45 and 64 in the United States with a correlation coefficient (R) of -0.657 and weighted average of $100,138. Similarly, the statistical analysis conducted on geographies consisting of 39,943,055 people shows a substantial negative correlation between the proportion of Yup'ik and household income with householder between the ages 45 and 64 in the United States with a correlation coefficient (R) of -0.599 and weighted average of $81,000, a difference of 23.6%.
Householder Income Ages 45 - 64 years Correlation Summary
| Measurement | Moroccan | Yup'ik |
| Minimum | $33,750 | $21,563 |
| Maximum | $151,275 | $127,108 |
| Range | $117,525 | $105,545 |
| Mean | $92,917 | $69,372 |
| Median | $96,708 | $64,271 |
| Interquartile 25% (IQ1) | $79,167 | $46,840 |
| Interquartile 75% (IQ3) | $108,085 | $91,495 |
| Interquartile Range (IQR) | $28,918 | $44,656 |
| Standard Deviation (Sample) | $26,273 | $27,859 |
| Standard Deviation (Population) | $25,895 | $27,626 |
Similar Demographics by Householder Income Ages 45 - 64 years
Demographics Similar to Moroccans by Householder Income Ages 45 - 64 years
In terms of householder income ages 45 - 64 years, the demographic groups most similar to Moroccans are Immigrants from Costa Rica ($100,141, a difference of 0.0%), Immigrants from Cameroon ($100,084, a difference of 0.050%), Belgian ($100,060, a difference of 0.080%), German ($100,224, a difference of 0.090%), and Aleut ($100,052, a difference of 0.090%).
| Demographics | Rating | Rank | Householder Income Ages 45 - 64 years |
| Slovaks | 58.8 /100 | #170 | Average $101,029 |
| South Americans | 56.4 /100 | #171 | Average $100,837 |
| Immigrants | Uzbekistan | 52.5 /100 | #172 | Average $100,523 |
| Alsatians | 51.4 /100 | #173 | Average $100,435 |
| Welsh | 50.0 /100 | #174 | Average $100,322 |
| Germans | 48.8 /100 | #175 | Average $100,224 |
| Immigrants | Costa Rica | 47.7 /100 | #176 | Average $100,141 |
| Moroccans | 47.7 /100 | #177 | Average $100,138 |
| Immigrants | Cameroon | 47.0 /100 | #178 | Average $100,084 |
| Belgians | 46.7 /100 | #179 | Average $100,060 |
| Aleuts | 46.6 /100 | #180 | Average $100,052 |
| Immigrants | Immigrants | 45.3 /100 | #181 | Average $99,943 |
| Finns | 44.8 /100 | #182 | Average $99,904 |
| Spaniards | 44.6 /100 | #183 | Average $99,889 |
| French | 43.8 /100 | #184 | Average $99,824 |
Demographics Similar to Yup'ik by Householder Income Ages 45 - 64 years
In terms of householder income ages 45 - 64 years, the demographic groups most similar to Yup'ik are Immigrants from Cuba ($80,662, a difference of 0.42%), Bahamian ($81,369, a difference of 0.46%), Dominican ($80,623, a difference of 0.47%), Sioux ($81,750, a difference of 0.93%), and Seminole ($80,077, a difference of 1.1%).
| Demographics | Rating | Rank | Householder Income Ages 45 - 64 years |
| Colville | 0.0 /100 | #317 | Tragic $82,474 |
| Choctaw | 0.0 /100 | #318 | Tragic $82,287 |
| Chickasaw | 0.0 /100 | #319 | Tragic $82,193 |
| Apache | 0.0 /100 | #320 | Tragic $82,184 |
| Yuman | 0.0 /100 | #321 | Tragic $82,139 |
| Sioux | 0.0 /100 | #322 | Tragic $81,750 |
| Bahamians | 0.0 /100 | #323 | Tragic $81,369 |
| Yup'ik | 0.0 /100 | #324 | Tragic $81,000 |
| Immigrants | Cuba | 0.0 /100 | #325 | Tragic $80,662 |
| Dominicans | 0.0 /100 | #326 | Tragic $80,623 |
| Seminole | 0.0 /100 | #327 | Tragic $80,077 |
| Natives/Alaskans | 0.0 /100 | #328 | Tragic $79,816 |
| Dutch West Indians | 0.0 /100 | #329 | Tragic $79,171 |
| Creek | 0.0 /100 | #330 | Tragic $78,960 |
| Immigrants | Dominican Republic | 0.0 /100 | #331 | Tragic $78,836 |